blankblank blank


Archive for the 'Web apps' Category Page 7 of 10


Get A Point Position With GetLatLon

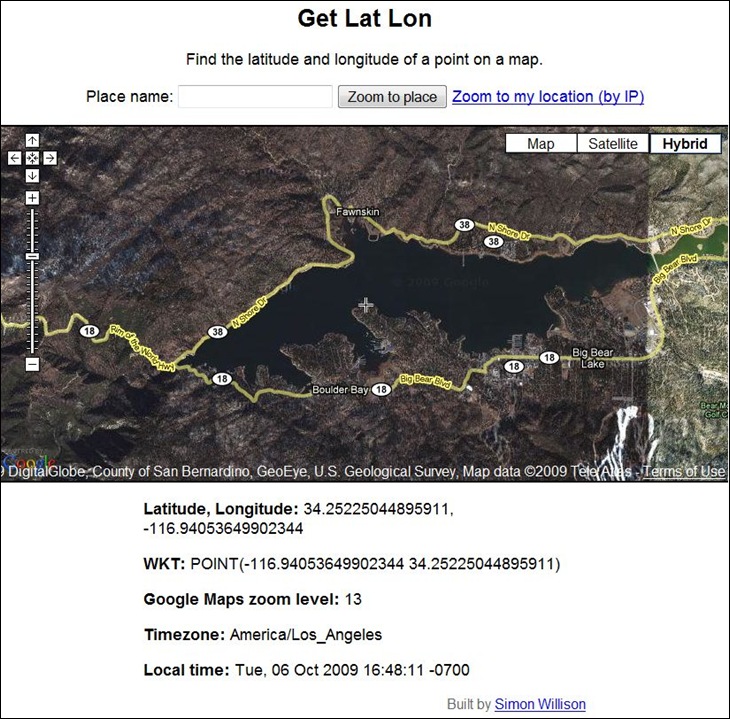
GetLatLon pretty much does exactly what its name implies – gives you the latitude/longitude of a point in a Google Maps interface. A crosshair at the center of the display marks the position for which coordinates are given at the bottom:

getlatlon

Digipoint can perform the same function, plus many more, but if all you need is a coordinate position, GetLatLon has a stripped-down simplicity that makes it easier to use. Just keep in mind that coordinate positions in Google Maps can be tens of meters off from the true position (see here and here).

Via Download Squad.


Embeddable US Demographics Map

As a demo of the ArcGIS API for Flex, ESRI has a new page that lets you create an embeddable/shareable map of demographic data by US county. Only seven datasets available now:

  • Median Household Income
  • Population Change 2000-2009
  • Population Density (per sq. mile)
  • Median Home Value
  • Unemployment Rate
  • Average Household Size
  • Median Age

Map creation is trivially easy – select the demographic dataset from a dropdown, zoom the map to the desired extents, set a map size in pixels, and you’re done; links to a map with your parameters, and code for an embeddable map, are generated automatically. Here’s an embedded map, scrollable and zoomable; unemployment rate is the defaultdataset, but you can choose other sets with the dropdown menu at upper right:

More datasets would be nice, as would control over colors and ranges …

Via GIS And Science.


Convert/Reproject Shapefiles And KML Files To SVG Format With indiemapper

indiemapper is a promising-looking thematic mapping service that is supposed to come online shortly. But until then, they’ve released a free  online Flash application that lets you upload vector data (point, line or polygon) in KML or shapefile format, re-project it into one of 11 different projections …

  • Equirectangular
  • Mercator
  • Winkel Tripel
  • Robinson
  • Albers Equal Area Conic
  • Lambert Conformal Conic
  • Orthographic
  • Polyconic
  • Sinusoidal
  • Bonne
  • Cylindrical Equal Area

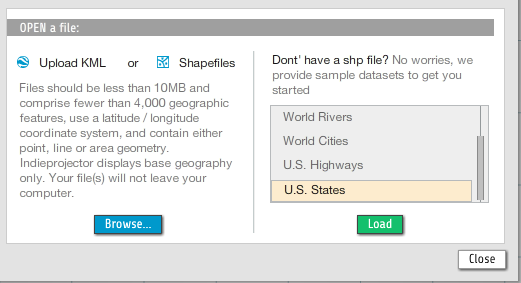
… and then export it as an Scalable Vector Graphic (SVG) file for use in programs like Adobe Illustrator or Inkscape. Shapefiles must be in geographic coordinates (latitude/longitude), WGS84; KML files are already in this format. Network KML files are acceptable. Add a file to the display, or choose one or more of their sample datasets:
open

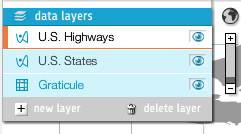
You can load multiple datasets into the display, move their draw order, and turn them on and off  by clicking on the “eye” icon:
datalayers

The graticule grid can be turned on and off, and spacing set to automatic or manual.

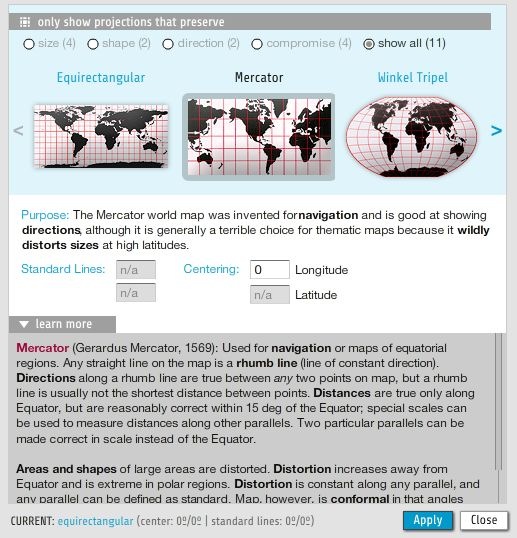
Select the projection using the “Project” button at upper-right:
projections

You’ll get info about the projection, including its pluses and minuses. Here’s Mercator (a screen capture, not SVG):
mercator

And Albers Equal Area Conic:

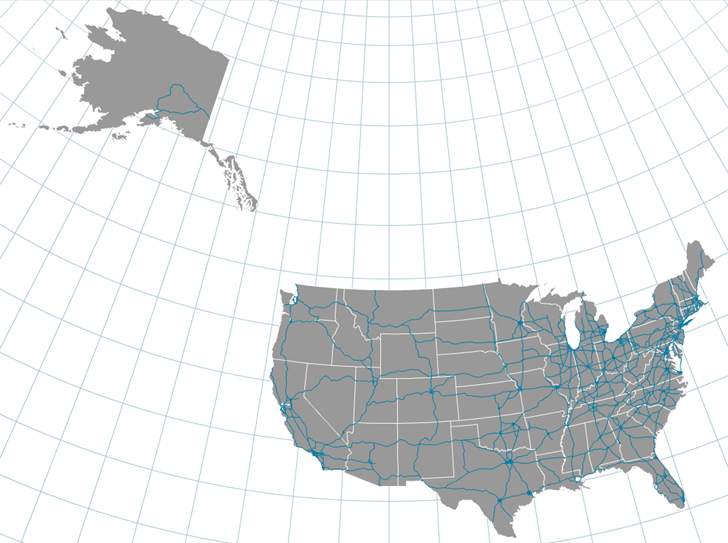
albers

With the center latitude/longitude of view adjustable. Once done, click on the “Export” button at upper right to convert the vector data to SVG format, and download it to your computer for use in vector editing software, or for viewing in a compatible browser like Firefox.

There are limitations for now. There’s no control over layer colors, and no thematic coloring based on the attributes of the vector files. It looks like the full indiemapper application will have those, and the screenshots make it look interesting, but it’s not clear yet whether that full online app will have a free version. Stay tuned.

Via the thematic mapping blog.


Two IP Mapping Utilities

Two online applications for mapping IP addresses:

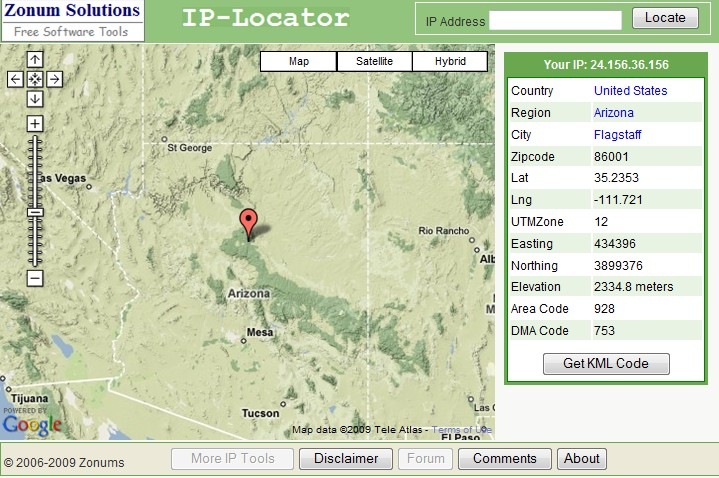
IP-Locator:  Plots the location of your current IP address, gives the approximate coordinates and elevation, with the option to export it as a KML file.

4-8-2009-8.56.37 PM

You can also type in an IP address, and get its geographic location plotted as well, with KML export. But for more than one IP address, and multiple export formats, there’s ….

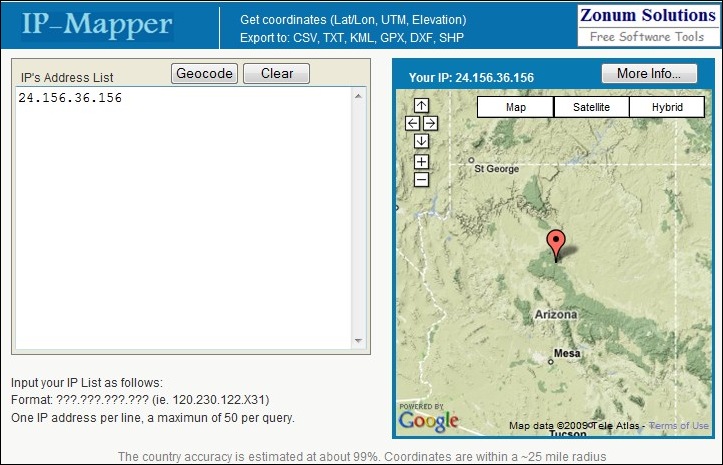
IP-Mapper: – Enter a list of IP addresses in the box at left:

4-8-2009-9.01.43 PM

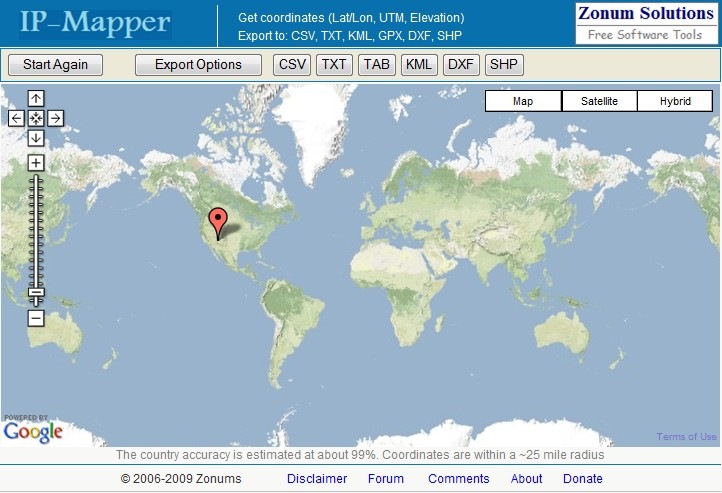
Click on Geocode, and get back the position(s) of the IP addresses plotted on a world map, along with the option to export the data in KML, CSV, DXF, shapefile, Tab-delimited or plain text formats:

4-8-2009-9.09.53 PM

Two additional notes:

  • If you want to find the numerical IP address for a website, do a Google Search for “domain name lookup” to find dozens of online apps that do just that, e.g. IP Address Lookup.
  • The geographic location derived from a website IP address is for the server hosting the website, which isn’t necessarily where the website content originates. Free Geography Tools’ IP address is 69.89.31.179; plug that in, and you’ll find that the server is located in Orem, Utah, whereas I am in, and plan to stay in, Flagstaff, Arizona.


Digipoint, Export Of Google Maps Point Coordinates, Upgraded To Version 3

I’ve posted before about Digipoint (version 1 and version 2), a web app that lets you select points in a Google Maps interface, then export their coordinates in a variety of formats. Version 3 of Digipoint is now out, with some modest improvements:

  • A new interface, a bit easier to use, and which works better in browsers where the default font size has been modified
  • Fly-to: Specify an address, country, or location, and the map will automatically go there. There are also a limited number of pre-specified country/region links, where  clicking on the link takes you to the area automatically
  • In previous versions, you had to copy/paste text for a particular export format like CSV or KML; you can now download the file automatically
  • For exported shapefiles, a corresponding prj file is also created to specify the coordinate system (your choice of geographic or UTM; WGS84)
  • Help section added

Still supports the same export formats as before: CSV, TXT, TAB, BLN (Surfer), GPX, KML, DXF and shapefile. Versions one and two are still available if you want them, but there’s no good reason to use them anymore.


Self-Colored Map Graphics

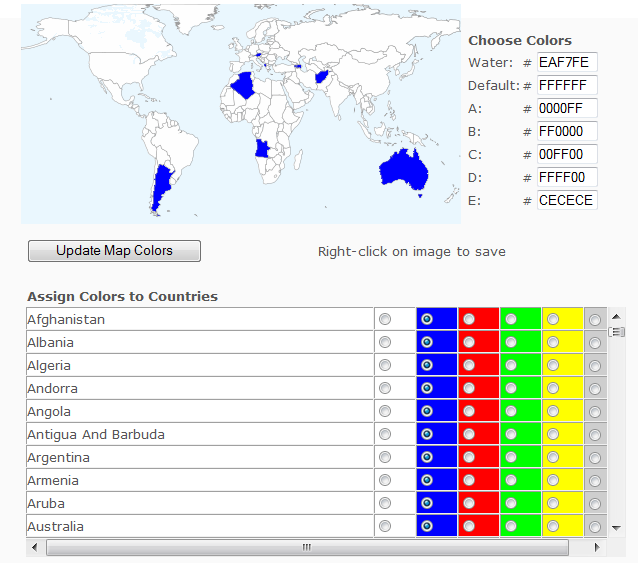
A while back, I covered a web app that lets you color in countries on a world map, then download the resulting graphic. Since then, it’s added more features, including the ability to add text, lines and labels. Mike Piaget writes to tell me of a similar app he’s created, the Customizable Map Of The World. Not as many options as the other app, but easier to use:

2-4-2009-1.48.12 PM

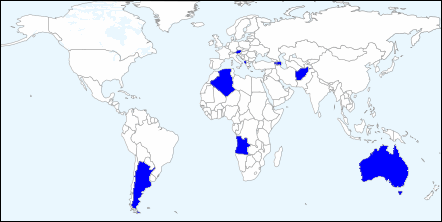
Click on a color next to the country name, then click “Update Map Colors” to color the country on the map; here, I’ve colored all world countries that start with the letter “A”. There’s only six colors available for country colors (including the default), plus one for water, but you can modify those colors with the appropriate hex code at upper right. To save a copy of the map to your computer, right-click on the image and choose the “Save Picture As ..” option (or the equivalent in your browser):

chart

Unfortunately, you’re limited to the single on-screen size; however, there are closeup maps available for the subregions Africa, Europe, Asia, the Middle East and South America (links at the bottom of the web app page).


Another New MapChannels Feature: Geography Quiz Maps

In addition to the new TeamMaps feature, MapChannels has a new embeddable geography game called QuizMaps:

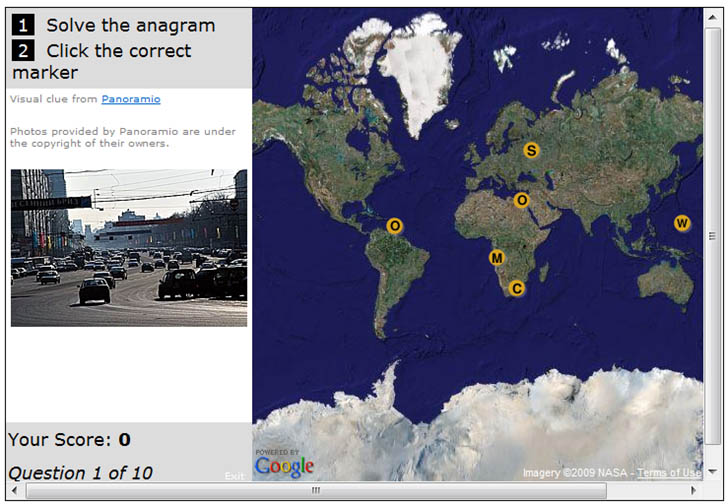
Choose World or State Capitals, and get a world/US map with letters plotted at various locations, as in the example screen capture below:

MapChannels geography quiz

Unscramble all the letters to get the correct answer; one of the letters is plotted at the same location as the answer. Panoramio photo clues from the answer location can show up on the left, but are usually as useless as the example you see above. The correct answer to the image above is left as an exercise for the reader.


Visitor-Editable Google “Team Maps” At Map Channels

The MapChannels website has a new feature called “Team Maps”, which lets you create an embeddable Google Maps view which visitors are free to add their own annotated markers to. From the website, features include:

  • (1) Create a new empty Team Map, (2) create a map from an existing KML or (3) create a map using a pre-defined event venue map data
  • Customizable data schema – allowing you to define a set of data fields for your place markers
  • Customizable info window and tooltip contents – use javascript template code to format your data schema
  • Pre-defined javascript template functions to display images, YouTube videos, website thumbnails and RSS feeds within info windows
  • Define the set of icons that can be used for map markers
  • Optionally select other Map Channels users to be an admin or editor for your map
  • Review user edits before applying any changes to your map
  • Lock the map to disable map editing by users
  • Automatically generate KML, GeoRSS and Tab-delimited text feeds for your map data
  • Import data from KML files (e.g. Google My Maps) or tab-delimited text (Spreadsheet) files
  • Embed your Team Map into a web page using a single line of HTML code. This code uses an IFrame, the URL within the IFrame can include parameters allowing you to display a specific place on the map (plus other options).

Here’s a simple active  map I created to test the service. The initial display bounds for the map are set automatically by the loaded data; for this map, I’ve added two placemarks already to set those bounds:

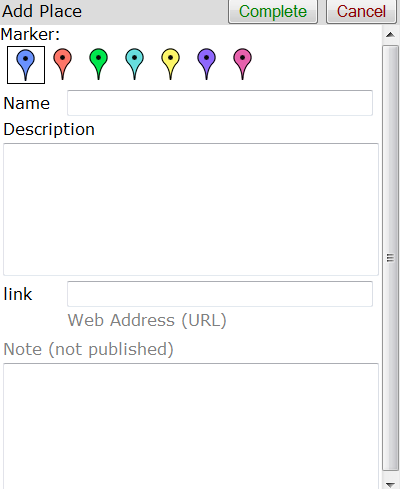
As a viewer of the map, you can submit a placemark for entry on this map using the “Add Place” link at the upper right; it lets you add not just a marker, but also a name, description, web link, and note for the map creator/editor:

1-7-2009-10.43.05 PM

You position the marker by dragging it on the map to the desired location. Once done, click on “Complete”, and your placemark is submitted to the map’s creator for review and approval before it shows up on the map. Feel free to add a placemark to the above map to try it out, but don’t look for it to show up – I won’t be reviewing/approving any submissions on this test map.

Current limitations (from the website):

  • Only markers (points) can be added to a Team Map. Lines and polygons are not yet supported
  • Team Maps are suitable for map collections of up to 500 markers, performance will be affected when you use a larger number of markers.
  • Please contact (MapChannels) if you are getting more than 5,000 page views per day for maps, this assists in planning server resources.