blankblank blank


Archive for the 'cartography' Category

Making Maps: A Visual Guide to Map Design For GIS – A Review Of The Second Edition

So I mentioned to a friend that I had just received a review copy of the new second edition of Making Maps by John Krygier and Denis Wood, and she exclaimed, “Oh, our university GIS department loves that book!”. No surprise – since its publication in 2006, the first edition has a become a staple on many mapmakers’ bookshelves, and I expect the second edition will “suffer” a similar fate. If you make maps, you’d be well-advised to have some version of this title nearby for inspiration and guidance.

One thing to keep in mind is that this isn’t really a how-to guide, or a cookbook on how to create maps. Krygier and Wood look more at the rationale you should use in making basic design decisions for your map and how to put it all together, and less so at how all the pieces fit together at the end (though that’s not entirely ignored). Examples abound, but usually look at the individual pieces of a map (color, typeface, symbology, classification, projection, etc.) rather than the whole. Think of this as the mapping equivalent of McGee’s kitchen science classic, On Food And Cooking; it will give you the information and understanding needed to figure out why a recipe works, but doesn’t actually give you any recipes to follow. For examples of good mapmaking practices, you might consider Brewer’s Designed Maps: A Sourcebook for GIS Users; for a more how-to oriented approach, Peterson’s GIS Cartography: A Guide to Effective Map Design is very good, albeit crazily over-priced. But Making Maps is the book I’d consult first for guidance and inspiration.

One point to keep in mind is the book’s design; it’s very visually-oriented, and the layout on most pages isn’t what I would call linear. This makes it a poor choice for a reference title, but that’s not really its intent. The design forces you to go through entire sections to pick up their meaning, and I’m pretty sure that was the authors’ intent. They don’t want you to pick up just a piece here and there about various aspects of map design, they want you to think about the whole process of putting together a map.

I do have a few quibbles with the book, two minor, the other major:

1. The book is primarily in grayscale, with a few random color plates scattered about, and only the chapter dealing with color in full color. The authors explain at the end that the basics of map design can be explained without using color, and that therefore the use of color is kept to a minimum to keep the cost of the book down. I understand this, but can’t help but think that a greater use of color throughout the book would have made it more effective.

2. The book is likely to be adopted by many courses as a primary or supplementary text. While each chapter ends with a nice page of references to additional titles, one thing I would have loved to have seen are exercises/problems to engage the reader in a more active study of the issues raised by the chapter.

3. Finally, the book makes one major misstep. A map of the non-stop round-the world trip of the Voyager aircraft in 1986 is used repeatedly as an example to illustrate many of the ideas raised by the chapters. And it’s a terrific map to use for that purpose:
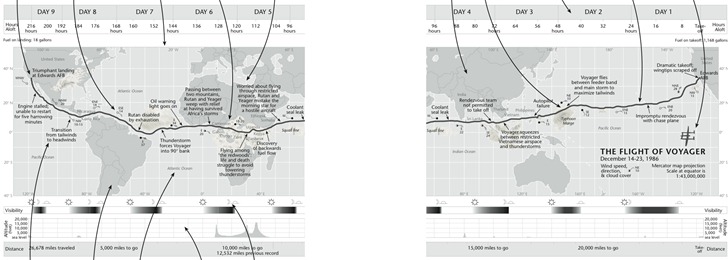
makingmapsishard1

But about halfway through the book, the authors highlight that the direction of travel of the Voyager, from east to west (right to left), is counter to the normal direction we expect to see chronological events portrayed, from left to right. They suggested to their editor that they flip the map upside down to make the time direction left to right, but had this suggestion rejected. But since it’s their book now, they do that:
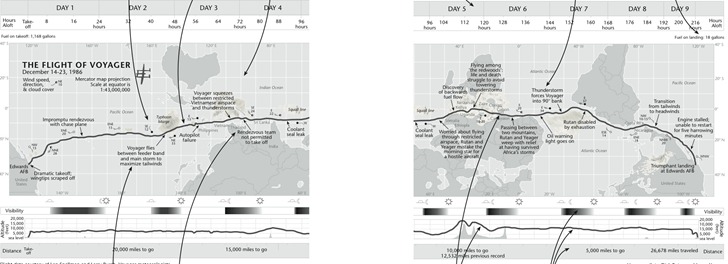
tufteonvoyager1

Noooooo! I couldn’t disagree more with this design decision. This is a map, a geographical construct, and geographic parameters should be primary here; you don’t mess with 500+ years of north being at the top unless there’s a very good reason for it, and time isn’t a good reason. Far better to put a few arrows in to indicate direction of travel/time than to make this directional flip. The author’s argument that the shape of South America is enough to “re-orient” the map for the viewer is undercut by the obscuring of the shape of Africa and North America, and the Pacific Ocean’s expanse, by plotted weather systems. It’s far easier to make the mental adjustment of time going right to left than dealing with “the world turn’d upside down”. I really hope they re-think this for the next edition.

If you don’t have the first edition, it’s a no-brainer for me to highly recommend this new second edition. But if you do have the first edition already, is the second edition worth the cost? Tough call. On his Making Maps blog, John Krygier goes through a list of the differences between the first and second edition, which included larger page size, adding extra map examples, and also paring down some of the content; the new edition is about 50 pages shorter than the first. I compared my copy of the first edition with the second, and there still is a substantial amount of overlap in material between the first and second editions, plus there are a fair number of examples missing from the second edition that I would have preferred they kept. Overall, while the second edition works better at presenting and explaining concepts than the first edition, it’s a toss-up in my mind whether it’s worth spending the extra $40 to upgrade if you already have the first (though you could, of course, buy the second edition for yourself and give your first edition to a starving cartography student ;-). But if you don’t have the first edition, and are serious about making good maps, grab a copy – you’re unlikely to be disappointed.
Geodetic Tools For Google Earth

Two weeks ago, I posted about a web app from Metzger and Willard that offers useful info like PLSS data and a topo quad index in a Google Earth plugin interface. Poking around their site further, turns out they have a page called Earth Survey, a set of KML network links that installs those features into the stand-alone version of Google Earth, plus additional links that offer data not found in that web app. KML network links include:

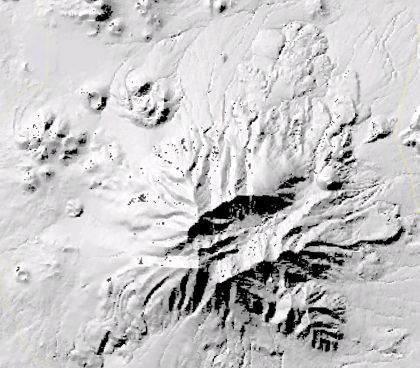
QUADS – Displays an index for USGS quad maps, and also the maps themselves as an overlay. Also has overlays for aerial digital orthoquads (color and B&W), and shaded relief maps (color and B&W). The color relief is pretty low-res, though, and the B&W relief appears to be based on unpatched SRTM data, as it has a fair number of holes:

relief


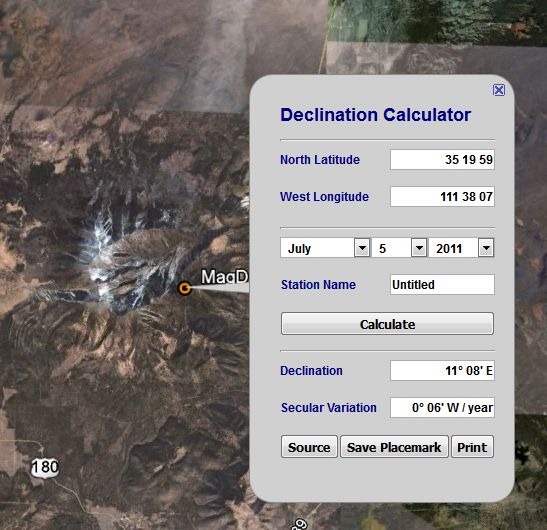
MagDec– Magnetic declination for any point in the world:

magdec

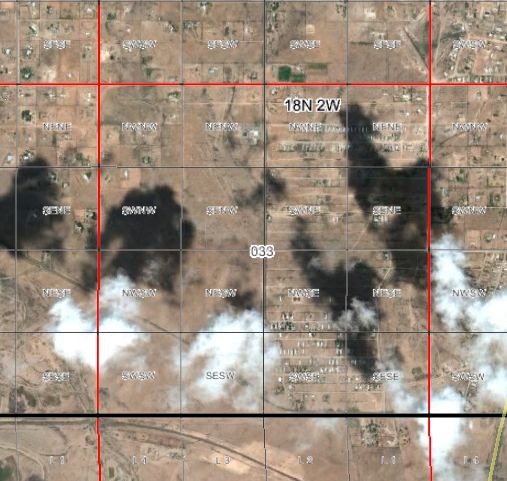
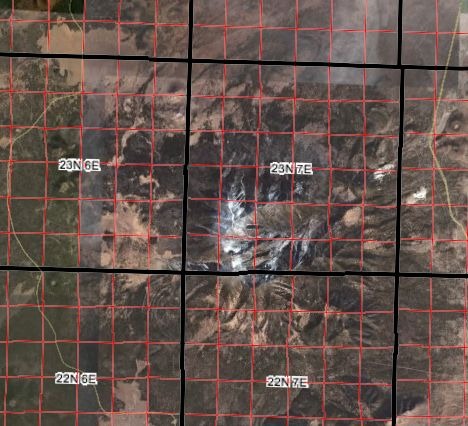
PLSGE– Township/range/section/quadrant/subquadrant, meridian and special survey overlays:

2011-07-05_143305

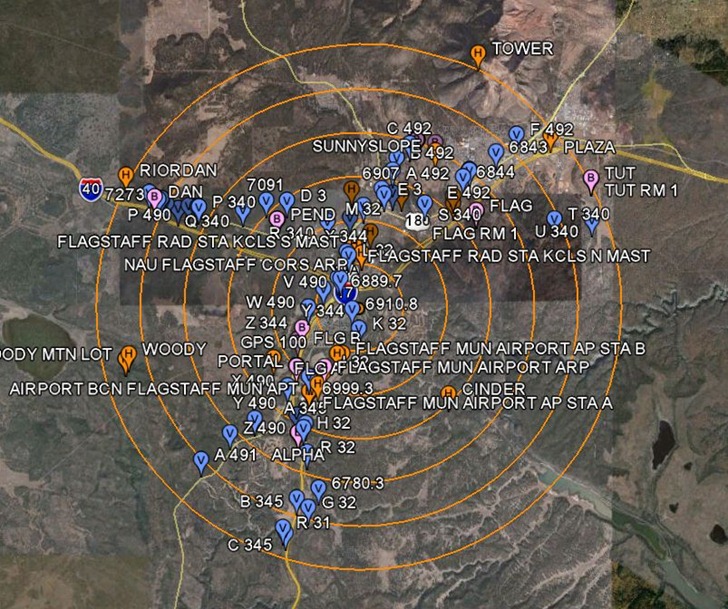
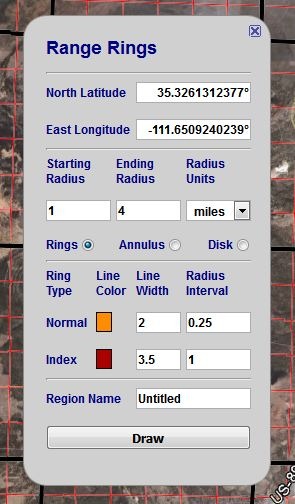
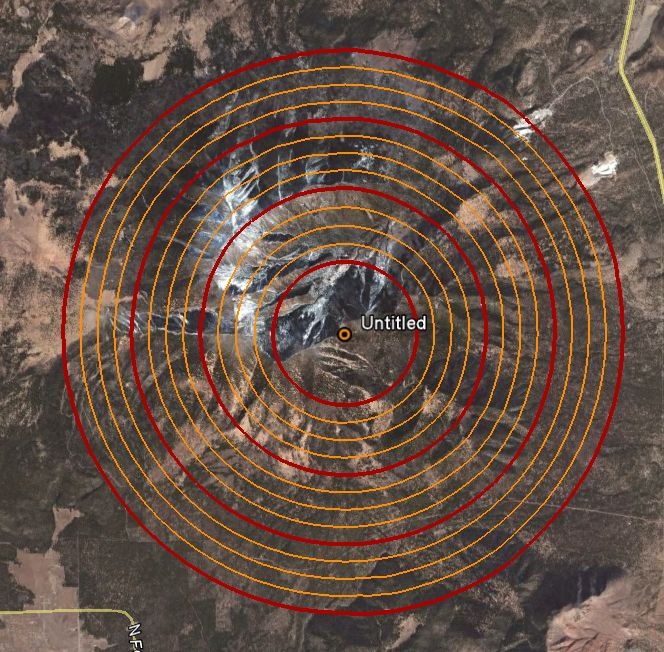
RINGS – Easy range ring generator for Google Earth:

ringssetup

ringsdrawn

Rings show up in a separate folder called “Saved Places”; right-click on that folder and choose “Save As”, and you can save the rings as a static KML file for future use.

NGSCS – National Geodetic Survey Control Stations. Note that you have to click on Query Setup to specify search conditions, and then check the Search Results box in the Place pane to view them. Unlike the web app, there doesn’t appear to be a way to save a static KML file for a control station, though you can save the network link for that search result.

control

Other available links include a NAD27 to NAD83 shift calculator, a State Plane Coordinate System (SPCS) converter,  and front-ends for the NGS online tools DEFLEC09 (“represents the deflections of the vertical at the surface of the Earth.”),  GEOID09 (“refined hybrid model of the geoid in the United States and other territories”), VERTCON (“NGVD29-to-NAVD88 and NAVD88-to-NGVD29 orthoheight conversions”), and XYZ (“converting between Geodetic Latitude-Longitude-Ellipsoid_ht and XYZ on the GRS80 Ellipsoid”).


Earth Survey Plugin: NGS Benchmarks, PLSS Data, USGS Quad Data And More

A while back, I posted about a free web app from Metzger and Willard that shows National Geodetic Survey control points (benchmarks) near a specific area, and lets you view data for those landmarks. I’ve just noticed that they’ve created a newer web app called the Earth Survey Plugin, running in a Google Earth browser plugin that not only has the same capability, but also adds a bunch of additional features:

  • An NGS Survey Marker capability that works very similarly to the previous app, but now offers the ability to export the data into a static KML file
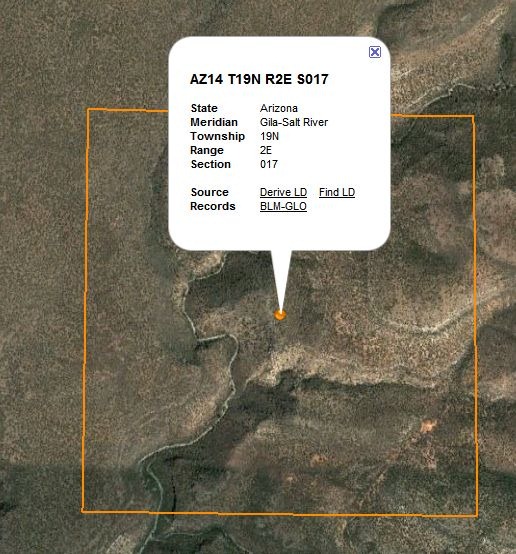
  • A PLSS point geocoder function that either gives you the section data for the point in the middle of the display:

plsspoint

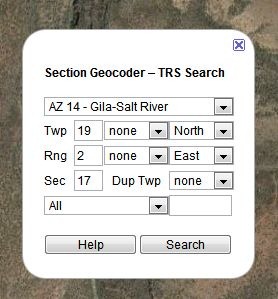
… or lets you enter the PLSS parameters, and find the center point associate with them:

plsslookup

These can also be saved as a KML file.

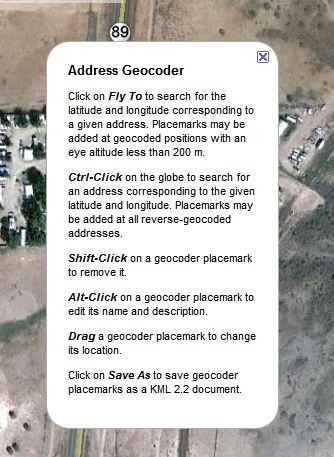
  • A click-to-geocode function:

geocoder

Plus, a set of overlays:

  • PLSS sections, including quadrants and subquadrants:

plssquads

  • Principal meridians:

meridians

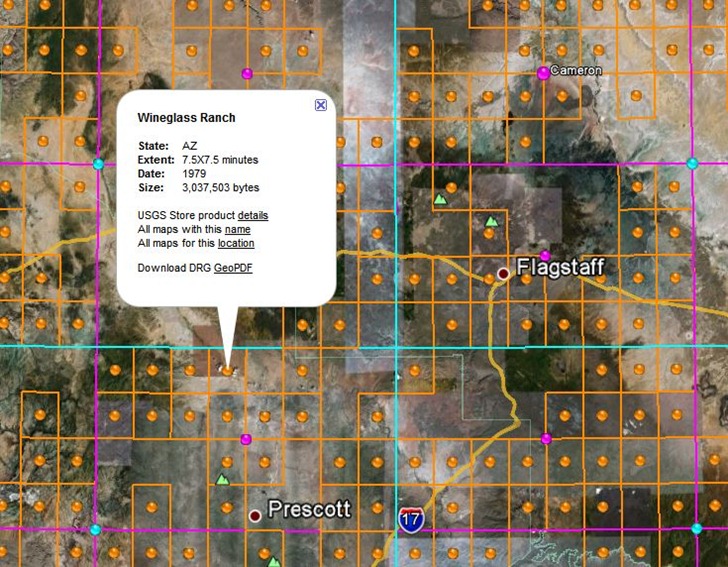
  • USGS topo quad index; orange dots for 1:24K, purple for 1:100K, cyan for 1:250K. Clicking on a dot brings up a pop-up balloon with the name of a quad, and a direct link to the GeoPDF for that quad at the USGS store. Note that GeoPDF quads are not currently available for quads in US National Forests, and that at this time, some states (e.g. AZ, CA) don’t have full topographic information on their GeoPDF quads.

usgsindex

  • Actual USGS topo map views, with the scale depending on your zoom level.


National Geodetic Survey Online Toolkit

The National Geodetic Survey has a set of links online conversion utilities for performing some basic geodetic conversions, including:

  • High-accuracy state plane coordinate system (SPCS) conversions
  • UTM/USNG/geographic coordinate conversions
  • Magnetic declination
  • Surface gravity prediction
  • Azimuth/distance to a second position (or second position from azimuth/distance data)
  • Position from a dual-frequency GPS data file

Plus many more. Some of these are also available as PC programs, but these tend to be old-school DOS-based conversion utilities, not always the most user friendly.


Free Books From The National Academies Press

SlashGeo posts on the June 2nd announcement by National Academies Press that all their PDF book titles are now freely available for download, or for online reading. National Academies Press is the publishing arm of the National Academy of Sciences, National Academy of Engineering, Institute of Medicine, and National Research Council. A search using geography-related terms (e.g. GIS, GPS, geography, maps, cartography, etc.) will bring up long lists of titles. They’re a bit of a mixed bag, though – most of them are more along the lines of committee reports, executive summaries, available resources and project planning than they are of more practical applications. Still, worth a look, especially at the price ;-). For many of them, you can also buy hard copies, and even embed a widget for them onto your website to allow people direct access to the book.

Here’s a few potentially interesting titles I picked out with random searching (assuming WordPress doesn’t trash the embed code, the way it sometimes does):


Free Marine Chart Views, Plus An Online Waypoint/Route Editor With GPS Export

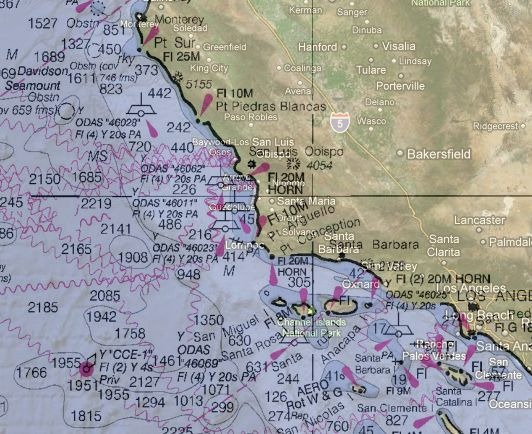
The Marine GeoGarage site offers free online views of marine charts from the following countries:

  • USA
  • Bahamas
  • Argentina
  • Brazil
  • Netherlands

A  10-euro monthly subscription (free 14-day trial) gets rid of the ads, and adds charts for the following countries:

  • UK and vicinity
  • Canada
  • Australia

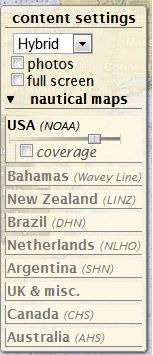
Choose the country from the list at upper-right:

gg_1

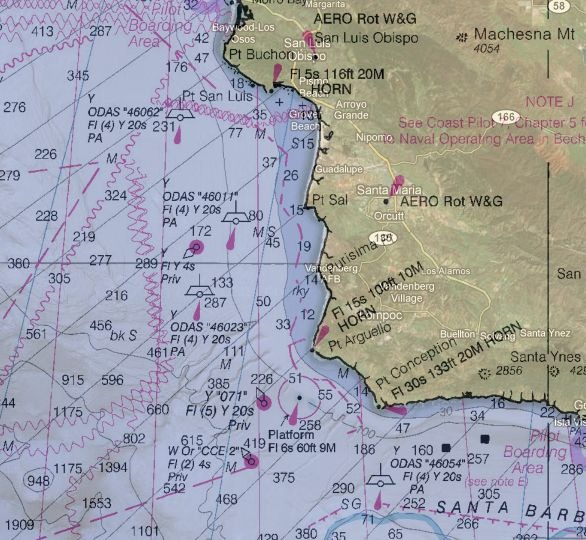
The slider controls the transparency of the marine chart overlay in Google Maps; slide it all the way to the right, and the map disappears completely (more on this shortly). Map detail level scales with the zoom, so if you start zoomed out:

gg_2

And then zoom in :

gg_3

Map detail scales accordingly, if maps are available at different scales.

There are three checkboxes in the control section:

  • photos – shows geotagged panoramio photos. There’s usually so many of them near coastal areas that this feature is pretty useless.
  • fullscreen – Blows up the map interface to full size (but doesn’t get rid of ads in the free version).
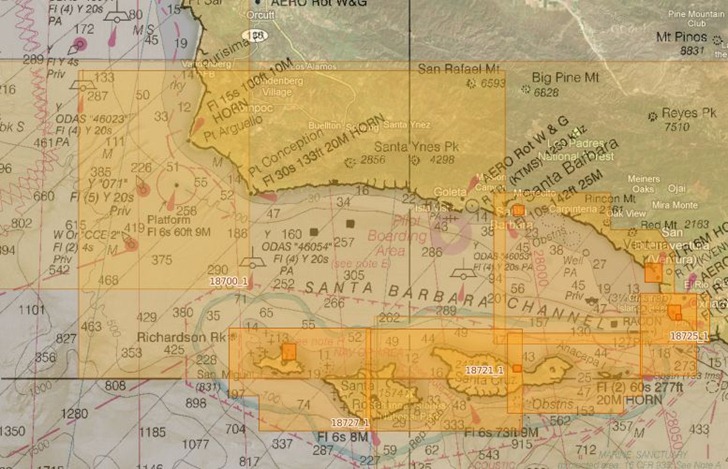
  • coverage – Shows the coverage areas for all marine charts available at different scales, useful for seeing whether you can zoom in for more information:

coverage


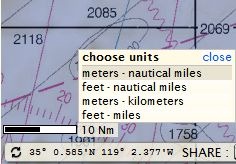
There’s a scalebar at lower left, with the option to set the distance units used, and view the cursor coordinates (though the latter is a bit slow to update):

scalebar

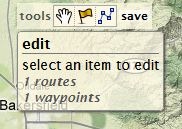
So far, useful mainly for mariners. But the site also has editing tools that let you create GPS waypoints and routes; while these are useful for marine navigators, setting the map transparency to 100% lets you create terrestrial GPS waypoints and routes anywhere in the world. For example, by using the waypoints and routes toolbar:

tools

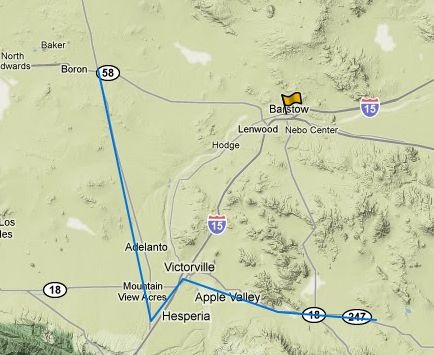
Plus setting the marine charts invisible, and setting Google Maps to Terrain view, I can create/edit waypoints and routes:

wr

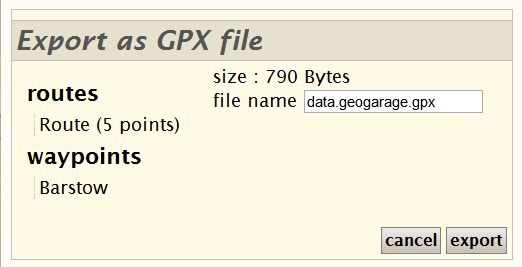
And then export them to a GPX file for use on my GPS:

export

If you own a Garmin GPS unit, and you have the free Garmin Communicator plugin installed on your browser, you can even export the data directly from the website to a connected Garmin GPS.  Logging in with either free registration, OpenID, Google login, or other credentials, lets you save this data online for future editing and use.


Photorealistic Views Of The Earth Over The Last 750 Million Years

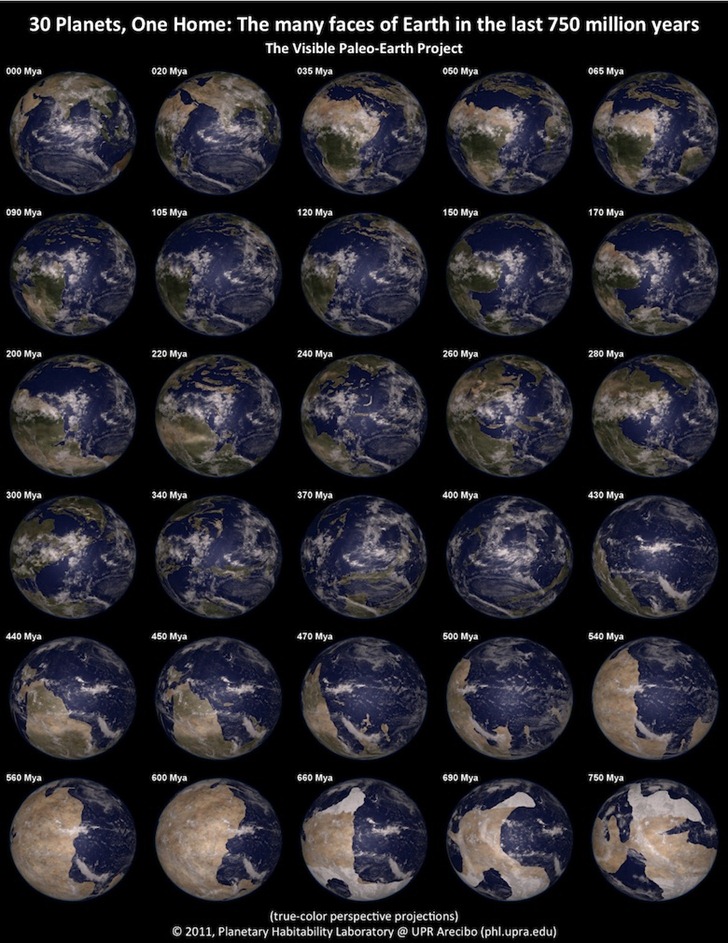
The Visible Paleo-Earth project has combined geological, paleontological, and paleoclimatological data with the paleogeographic maps of Ron Blakey (visible here and here) to create a series of Blue-Marble-type views of the earth spanning the last 750 million years:

VPE_30Planets_LR

Basic graphic imagery and the simple YouTube video animation below were released last week:

Basic graphic imagery and the simple YouTube video animation below were released last week:

More animations, and higher-resolution imagery, are scheduled to be released today (4/29/2011).

If you’re at all interested in the relationship between ancient geographies and climate, and how they created the geology of the Colorado Plateau, I highly recommend the book Ancient Landscapes by Ron Blakey and Wayne Ranney, a terrific synthesis of geology, geography, paleontology and cartography.


National Geographic Society Education Site In Beta

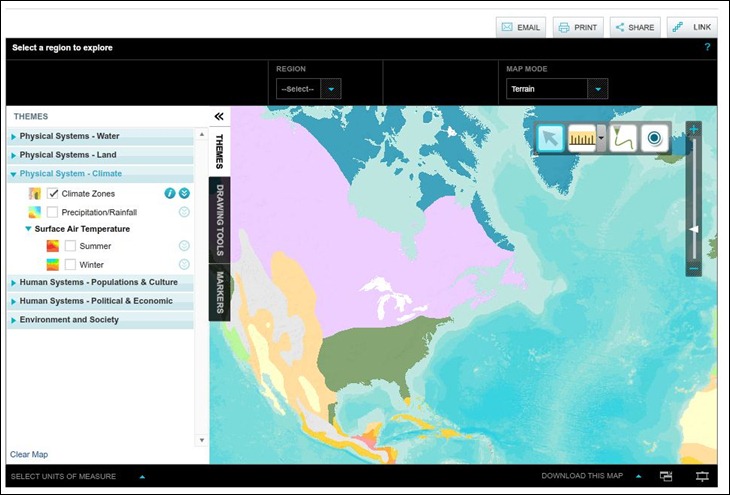
The National Geographic Society has completely revamped their Education site, and it’s now in beta; lot of features and resources already there, with more being added on a regular basis. While there’s lots of information sources for browsing and downloading, maps are already a major focus (not surprisingly). There’s MapMaker Interactive, which lets you create and download thematic maps, with measurement and markup capabilities:

ng_1

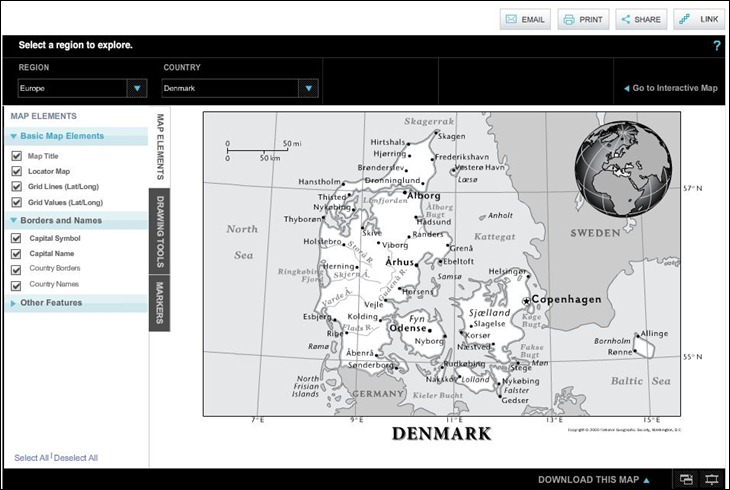
The MapMaker 1-Page Maps offer similar capabilities for standard line-drawing-style maps:

ng_2

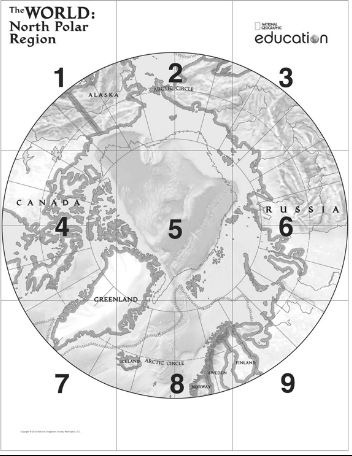
And MapMaker Kits are pre-packaged mapsets that can be printed out at wall or tabletop size (tiled sections that can be assembled into larger maps):

ng_3

More info, and mapping activities, at the Mapping page of the site.