blankblank blank


Archive for the 'GIS' Category

Making Maps: A Visual Guide to Map Design For GIS – A Review Of The Second Edition

So I mentioned to a friend that I had just received a review copy of the new second edition of Making Maps by John Krygier and Denis Wood, and she exclaimed, “Oh, our university GIS department loves that book!”. No surprise – since its publication in 2006, the first edition has a become a staple on many mapmakers’ bookshelves, and I expect the second edition will “suffer” a similar fate. If you make maps, you’d be well-advised to have some version of this title nearby for inspiration and guidance.

One thing to keep in mind is that this isn’t really a how-to guide, or a cookbook on how to create maps. Krygier and Wood look more at the rationale you should use in making basic design decisions for your map and how to put it all together, and less so at how all the pieces fit together at the end (though that’s not entirely ignored). Examples abound, but usually look at the individual pieces of a map (color, typeface, symbology, classification, projection, etc.) rather than the whole. Think of this as the mapping equivalent of McGee’s kitchen science classic, On Food And Cooking; it will give you the information and understanding needed to figure out why a recipe works, but doesn’t actually give you any recipes to follow. For examples of good mapmaking practices, you might consider Brewer’s Designed Maps: A Sourcebook for GIS Users; for a more how-to oriented approach, Peterson’s GIS Cartography: A Guide to Effective Map Design is very good, albeit crazily over-priced. But Making Maps is the book I’d consult first for guidance and inspiration.

One point to keep in mind is the book’s design; it’s very visually-oriented, and the layout on most pages isn’t what I would call linear. This makes it a poor choice for a reference title, but that’s not really its intent. The design forces you to go through entire sections to pick up their meaning, and I’m pretty sure that was the authors’ intent. They don’t want you to pick up just a piece here and there about various aspects of map design, they want you to think about the whole process of putting together a map.

I do have a few quibbles with the book, two minor, the other major:

1. The book is primarily in grayscale, with a few random color plates scattered about, and only the chapter dealing with color in full color. The authors explain at the end that the basics of map design can be explained without using color, and that therefore the use of color is kept to a minimum to keep the cost of the book down. I understand this, but can’t help but think that a greater use of color throughout the book would have made it more effective.

2. The book is likely to be adopted by many courses as a primary or supplementary text. While each chapter ends with a nice page of references to additional titles, one thing I would have loved to have seen are exercises/problems to engage the reader in a more active study of the issues raised by the chapter.

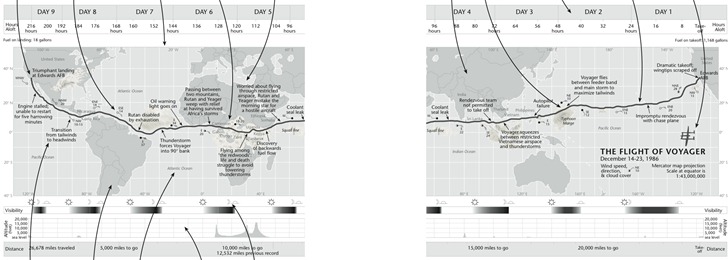
3. Finally, the book makes one major misstep. A map of the non-stop round-the world trip of the Voyager aircraft in 1986 is used repeatedly as an example to illustrate many of the ideas raised by the chapters. And it’s a terrific map to use for that purpose:
makingmapsishard1

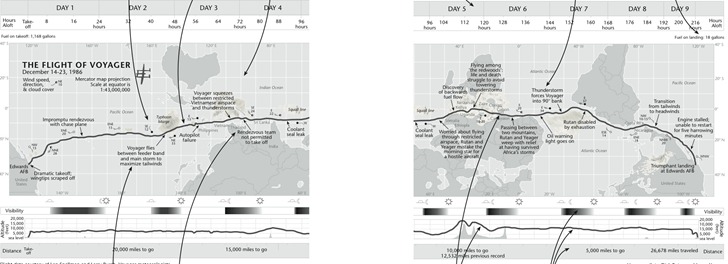
But about halfway through the book, the authors highlight that the direction of travel of the Voyager, from east to west (right to left), is counter to the normal direction we expect to see chronological events portrayed, from left to right. They suggested to their editor that they flip the map upside down to make the time direction left to right, but had this suggestion rejected. But since it’s their book now, they do that:
tufteonvoyager1

Noooooo! I couldn’t disagree more with this design decision. This is a map, a geographical construct, and geographic parameters should be primary here; you don’t mess with 500+ years of north being at the top unless there’s a very good reason for it, and time isn’t a good reason. Far better to put a few arrows in to indicate direction of travel/time than to make this directional flip. The author’s argument that the shape of South America is enough to “re-orient” the map for the viewer is undercut by the obscuring of the shape of Africa and North America, and the Pacific Ocean’s expanse, by plotted weather systems. It’s far easier to make the mental adjustment of time going right to left than dealing with “the world turn’d upside down”. I really hope they re-think this for the next edition.

If you don’t have the first edition, it’s a no-brainer for me to highly recommend this new second edition. But if you do have the first edition already, is the second edition worth the cost? Tough call. On his Making Maps blog, John Krygier goes through a list of the differences between the first and second edition, which included larger page size, adding extra map examples, and also paring down some of the content; the new edition is about 50 pages shorter than the first. I compared my copy of the first edition with the second, and there still is a substantial amount of overlap in material between the first and second editions, plus there are a fair number of examples missing from the second edition that I would have preferred they kept. Overall, while the second edition works better at presenting and explaining concepts than the first edition, it’s a toss-up in my mind whether it’s worth spending the extra $40 to upgrade if you already have the first (though you could, of course, buy the second edition for yourself and give your first edition to a starving cartography student ;-). But if you don’t have the first edition, and are serious about making good maps, grab a copy – you’re unlikely to be disappointed.
Portable Version Of The Open Source GIS gvSIG

gvSIG is a full-featured open source GIS program, written in Java; I’d go so far as to call it one of the two leading open source GIS programs currently available (Quantum GIS is the other). Version 1.11 was released recently, with standard installers available for both Windows and Linux (and a special installer for Mac). There’s an older version of gvSIG as part of Jo Cook’s Portable GIS on a stick package, which you can run from a thumb drive on Windows or Linux systems without installing the software directly. However, it looks as though there hasn’t been any work on that package for quite a while, so it’s unclear whether the latest version of gvSIG (or the other software programs in that package) will be added anytime soon.

However, the gvSIG office has just announced release of portable versions of gvSIG 1.11  that run on Windows and Linux systems from a thumb drive; you can also run it from a separate direction on your PC, bypassing full program installation completely. Total size of the unzipped package is 285 MB, making it fit easily on a 512 MB or larger thumb drive; if you compress the files in Windows (right-click, choose Properties, choose Advanced, then “Compress contents to save disk space”), it drops to 233 MB, making it just barely fit onto a 256 MB thumb drive. It contains not just the program and associated files, but even the Java Runtime Engine, so you don’t need to have Java installed on the system you’re running it on.

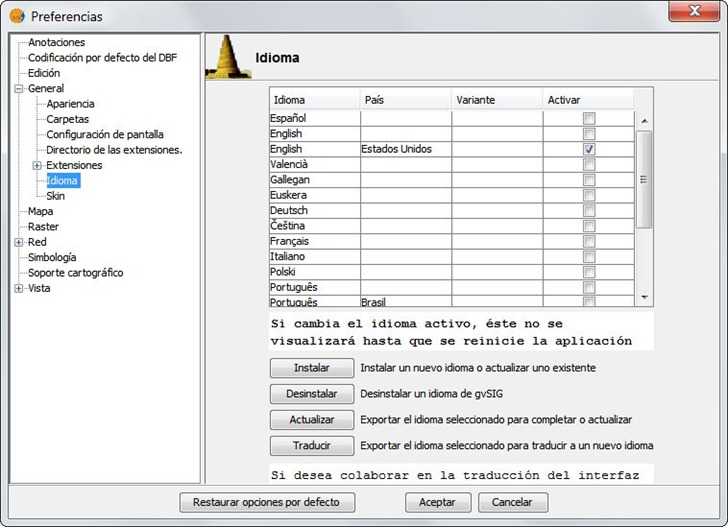
One minor quirk: it starts up with the default language being Spanish, not surprising since it’s developed in Spain. To switch over to English, or another language:

1. Run the program (gvsig.exe file in the bin directory for Windows, gvSIG.sh for Linux).

2. Go to the “Ventana” menu listing, and choose “Preferencias”.

3. Expand the “General” section, and choose “Idioma”.

4. Select your desired language (English below), click “Aceptar” at the bottom , then close and re-open the app.

idioma

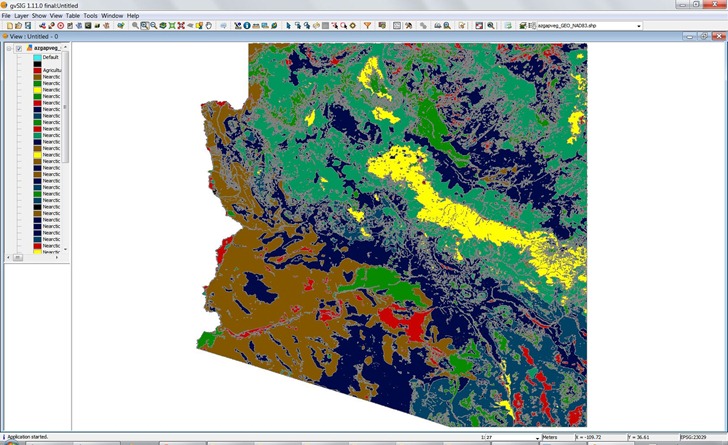
Seems to work as well as the standard installed desktop version, with all current extensions:

gvsig


Convert A Shapefile Into A Google Fusion Table

Google Fusion Tables is a free service from Google that lets you visualize, map, analyze and combine data. Standard data formats for import are spreadsheet data (including direct export from Google Docs), CSV and KML files. But you can use the Shape to Fusion website to convert shapefile data directly into Fusion Table format, including not just points but also lines and areas. Note: You will need to have a Google account, and will also need to give the Shape to Fusion website permission to access your Google account to upload the data.

The first thing you’ll need to do is prepare a zipped file for upload that contains the .shp, .shx and .dbf files associated with the shapefile; you’ll also need to include a .prj file that specifies the coordinate system used by the shapefile. You’re limited to 200 MB in total uploaded data, and a maximum of 200,000 rows of data. For line and area shapefiles, you have the option of simplifying the geometry to reduce the total row count; you can also create a centroid point for areas.

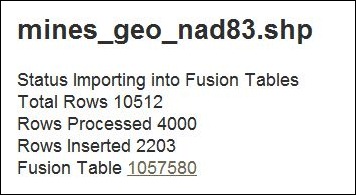
Depending on the size of the file, it can take a while to process; this sample file of mines in Arizona with 10,512 rows took about 10 minutes. A regularly-refreshed text page will show you the status:

mine_status

Once completed, you can directly access the Fusion Table data through the link at the bottom, or go to your Fusion Table data list and select the dataset; you can then analyze/visualize the data any way you choose, including maps. If you specify the data as public, you can embed it into a website. Here’s the active embedded map of Arizona mines used as sample data above; click on a point to get a pop-up with the name and products of the mine:

Note: Doesn’t seem to display properly in my copy of Internet Explorer 9; works fine in Chrome and Firefox.

Data can also be exported back out again in spreadsheet format, as a static KML file, or as a dynamic KML link that updates if the data changes.

Note: The source code for this app is available at this Google Code page.


GeoCommons Goes Into High Gear

Posted late last year about GeoCommons, a free service for uploading and displaying free publicly-accessible geographic data. Run by GeoIQ (formerly FortiusOne), this is the free public version of their commercial GeoIQ geographic data visualization service. If you haven’t been following their recent posts on their blog, you may have missed the huge number of new features they’ve added to GeoCommons and GeoIQ over the past six months:

Now they’ve just added a number of GIS-like analytical tools, already in their commercial GeoIQ product, to the free GeoCommons tool:

I’ve only played with this a bit, but it looks pretty damn cool; definitely crosses the border between neogeography tools and GIS. The free version is definitely worth a spin if your data can be freely distributed; if not, still worth a look as an example of what their paid/private GeoIQ service can do.


Free Books From The National Academies Press

SlashGeo posts on the June 2nd announcement by National Academies Press that all their PDF book titles are now freely available for download, or for online reading. National Academies Press is the publishing arm of the National Academy of Sciences, National Academy of Engineering, Institute of Medicine, and National Research Council. A search using geography-related terms (e.g. GIS, GPS, geography, maps, cartography, etc.) will bring up long lists of titles. They’re a bit of a mixed bag, though – most of them are more along the lines of committee reports, executive summaries, available resources and project planning than they are of more practical applications. Still, worth a look, especially at the price ;-). For many of them, you can also buy hard copies, and even embed a widget for them onto your website to allow people direct access to the book.

Here’s a few potentially interesting titles I picked out with random searching (assuming WordPress doesn’t trash the embed code, the way it sometimes does):


Cheap GeoPDF To GeoTiff Converter For Garmin Custom Map Imagery

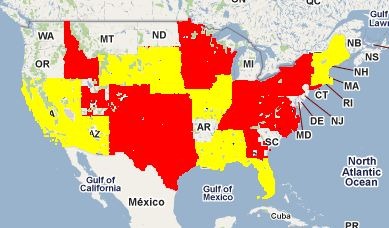
The USGS is well on its way to having updated all its 1:24,000 scale topographic maps (the classic 7.5-minute series) to digital format. As of today, the coverage map looks like this:

topos_done

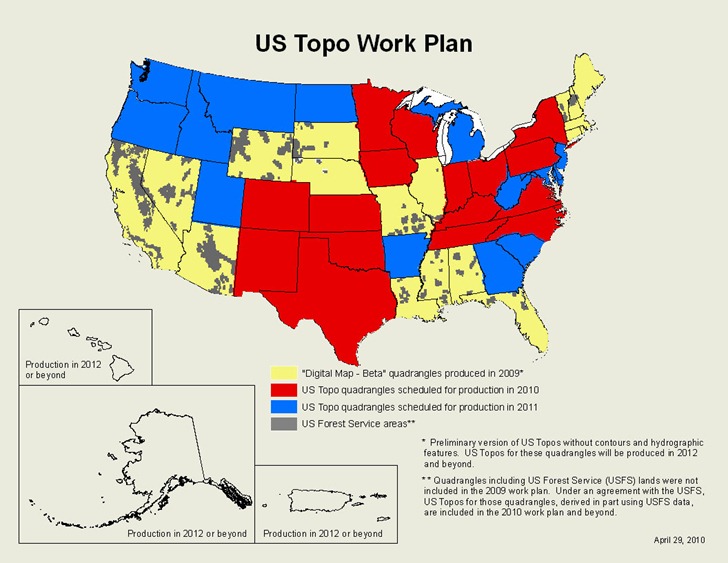
Areas covered in red are full topographic maps in in digital format; areas in yellow are “Digital Maps”, which have transportation features, boundaries, geographic names and aerial imagery, but no topographic contours or hydrographic features. According to the current schedule, most of the US will have either full topos or “Digital Maps” by the end of 2011, with Digital Maps scheduled for upgrade to full topographic maps starting in 2012:

work_plan

On one hand, the maps are very nice – they have multiple data layers, each with a separate kind of data, whose view can be turned on and off. Most data layers are vector, which means no more scaling/pixelization issues. On the other hand, the maps are currently only available in GeoPDF format, which limits their usability, particularly in GIS-related software. This was a conscious decision by the USGS:

The US Topo was not intended to be a GIS product. It was designed to serve users who need medium-scale topographic and orthoimage maps, but who are not GIS users.

US Topos are derived from GIS data. Almost all these data are from USGS and other government sources, and most are available for free through web services or file download sites. The US Topo represents a repackaging of these data, not new data creation. The primary design objective was to provide these data in a convenient and familiar form to people who need maps but who are not professional cartographers. The traditional 7.5-minute quadrangle layout and PDF format were selected as the best way to accomplish this objective; the GeoPDF extensions were adopted because they added some cartographic value at no cost to the end user.

Which is fine, but it still leaves some serious drawbacks with the format:

– As mentioned, not supported by most GIS programs, and I know that USGS topos are often used as the background base layer for maps. The USGS FAQ page mentions ArcGIS ($1500) and GlobalMapper ($350) as two options for converting GeoPDFs to GeoTiffs, but the price puts those out of reach of many.

– Printing the maps is a pain if you don’t have a large-format print, especially if you’re only interested in printing a subsection. The USGS Quickstart guide describes how to do it with Adobe Reader, and it’s not exactly a one-step process; what’s more, it’s virtually impossible to print to scale using their recommended procedure.

– Feature contrast isn’t always optimal, especially if you have the aerial imagery background turned on, and there’s no way to adjust that on a GeoPDF (unlike a GeoTiff).

– Newer Garmin GPS units support the Custom Map format, which lets you view custom raster imagery on the display screen; however, GeoPDFs aren’t in a raster imagery format that can be converted to this Custom Map format.

I’ve written a Garmin Custom Map utility called G-Raster, which converts GeoTiffs and other raster imagery types (KMZ overlays, MRSID, ECW, OziExplorer, graphics with worldfiles, BSB) into a Garmin-compatible Gustom Map format. Most features are free, but a few are unlocked with a $5 registration fee. The latest version (4.0) adds a new feature: a GeoPDF Tool GUI which can convert many (albeit not all) GeoPDFs into GeoTiff format. Interface is pretty bareboned – just specify the desired DPI of the final image, choose the GeoPDF filename, and a GeoTiff with the same name (but with “_gt” appended to the filename) will be created in the same directory as the original file:

tool_1

Also generated with the “listgeo” utility will be a “.gtf” file with that GeoTiff’s metadata; this file can be used to re-embed the metadata into a GeoTiff file that has been enhanced by a graphics editor that does not preserve geographic metadata.

For example

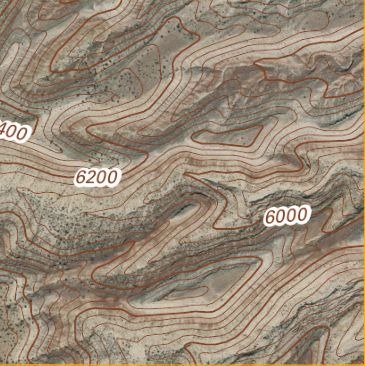
1.  I converted the Fruita, UT next-generation PDF into a GeoTiff:

plain

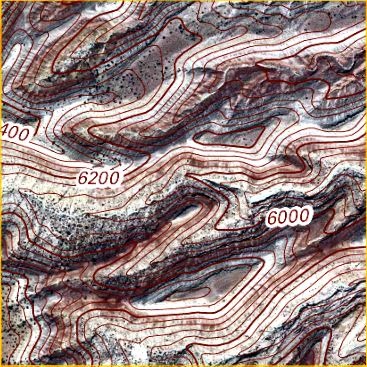
2. Garmin GPS units can have contrast issues when used in sunlight. So I loaded the GeoTiff into Photoshop to enhance contrast, and saved it under a different name; this process improved visibility, but also stripped out the geo metadata:

enhanced

3. I embedded the “.gtf” metadata back into the enhanced Tiff file using another tool included with G-Raster, and then converted it into a Garmin Custom Map (screenshot from my Garmin 62s):

140


Other features and limitations of the tool:

– The unregistered version limits you to a maximum size of 2000 x 2000 pixels; images larger than these limits will be cropped. Registering the program removes these limitations. This way, you can test the tool to make sure it works for you.

– Works fine with all next-generation USGS topo maps and Digital Maps in GeoPDF, as well as older maps in the UTM coordinate format. Some older GeoPDF topo maps that are in the Lambert Conformal Conic projection don’t reproject correctly; the GeoPDF Tool will identify those problematic files, to let you know they may not be correct.

– The USGS 1:24K input option in G-Raster will crop the collar of these next-gen topographic maps; another new option in G-Raster will let you export this collared topographic map in GeoTiff format (geographic projection, WGS84).

– Not all datums are currently supported; unrecognized datums are assumed to be WGS84. This is a good assumption for newer maps, a poor assumption for older ones. I do know that it does support NAD27 and NAD83 datums.

– There’s currently no way to turn off data layers in the GeoPDF when exporting it to GeoTiff format; all data layers are included. The help file includes a mildly-convoluted work-around hack that will let you create GeoPDFs with data layers turned off.

– Once in GeoTiff format, the next-gen topo maps can be opened in any compatible GIS program or graphics editor; you can then enhance/crop them, and easily print a smaller subsection. You can also print them to scale, or use poster printing to create maps larger than your printer’s maximum paper size.

More information about G-Raster, and a link where you can download it, can be found at the G-Raster web page.


Government GeoData In ArcGIS-Compatible Form From GovMaps.Org

ESRI’s GovMaps.Org website (currently in beta), currently offers a searchable catalog of 88  data layers (and presumably growing) hosted at ArcGIS.com, mainly from the US Government, covering a wide variety of subjects areas. A random sampling:

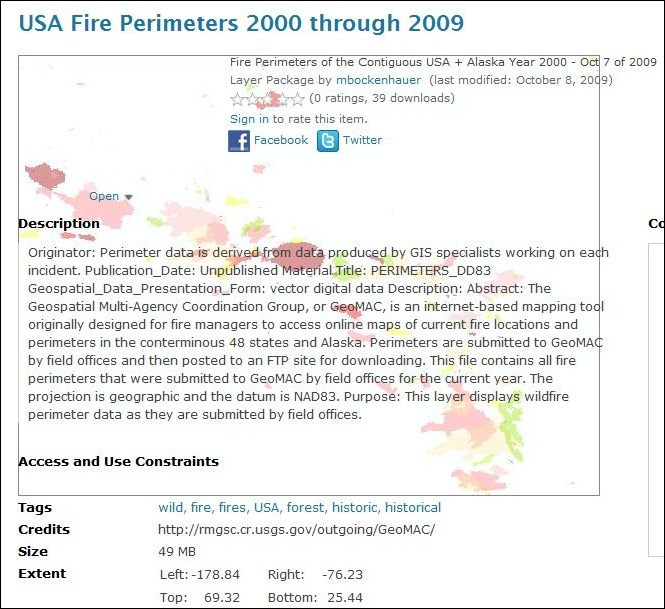
Click on a link, and it takes you to that data page at ArcGIS.com with more info, metadata links, and download links:

govmaps_1

Clicking on the arrow next  to the “Open” link gives you a number of options, depending on the kind of data:

– “Open in ArcGIS.com Viewer”: Opens up the data directly in ArcGIS.com’s web-based map viewer. Oddly, this option isn’t available for all datasets; hopefully, it will be soon.

– “Open in ArcGIS Desktop”: Downloads an item.pkinfo or .lyr file that ArcGIS Desktop can use to load/download the info.

– “Download”: Downloads the full data in a layer package file (.lpk) that ArcGIS Desktop can open directly.

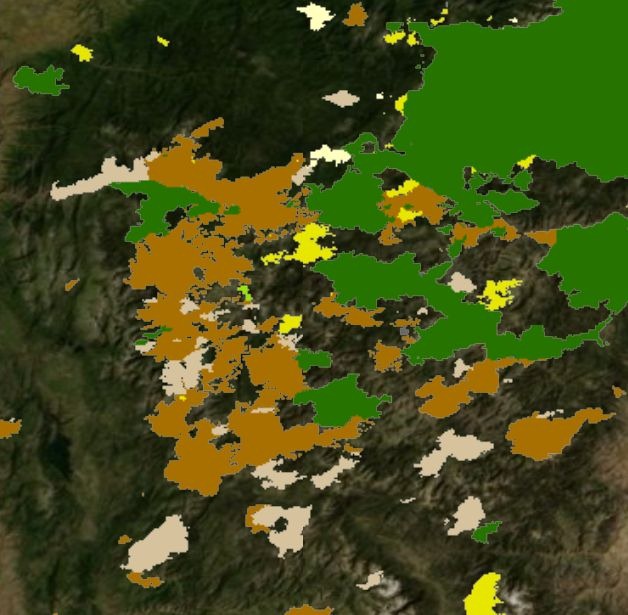
If you don’t own the expensive ArcGIS Desktop software, and want to view data that isn’t viewable at ArcGIS.com, any of the item.pkinfo, .lyr or .lpk files you download can also be opened up in ESRI’s free ArcGIS Desktop Explorer software, like the wildfire data shown below on top of the Bing Maps aerial basemap:

fire_data


WeoGeo Addendum

A short addendum to my post last Thursday on free geographic datasets from WeoGeo: