blankblank blank


Archive for the 'Google Earth' Category

Geodetic Tools For Google Earth

Two weeks ago, I posted about a web app from Metzger and Willard that offers useful info like PLSS data and a topo quad index in a Google Earth plugin interface. Poking around their site further, turns out they have a page called Earth Survey, a set of KML network links that installs those features into the stand-alone version of Google Earth, plus additional links that offer data not found in that web app. KML network links include:

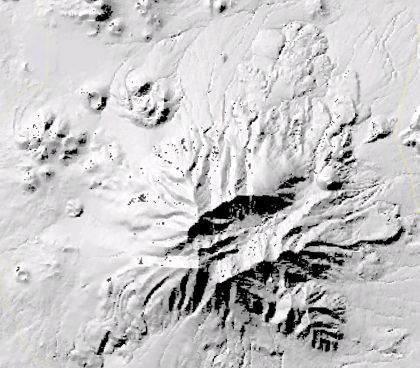
QUADS – Displays an index for USGS quad maps, and also the maps themselves as an overlay. Also has overlays for aerial digital orthoquads (color and B&W), and shaded relief maps (color and B&W). The color relief is pretty low-res, though, and the B&W relief appears to be based on unpatched SRTM data, as it has a fair number of holes:
relief


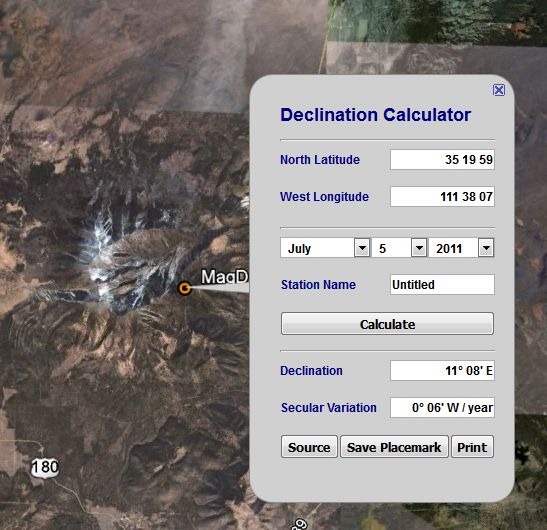
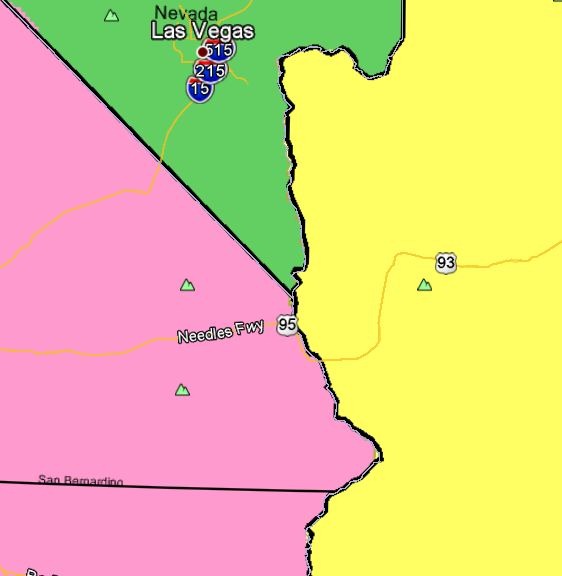
MagDec– Magnetic declination for any point in the world:
magdec

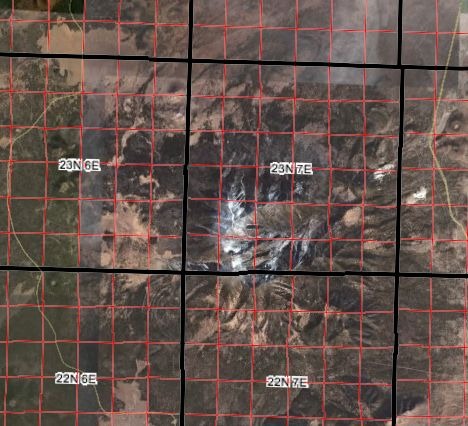
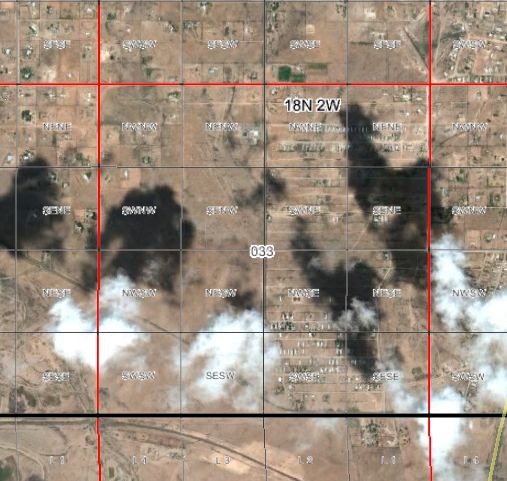
PLSGE– Township/range/section/quadrant/subquadrant, meridian and special survey overlays:
2011-07-05_143305

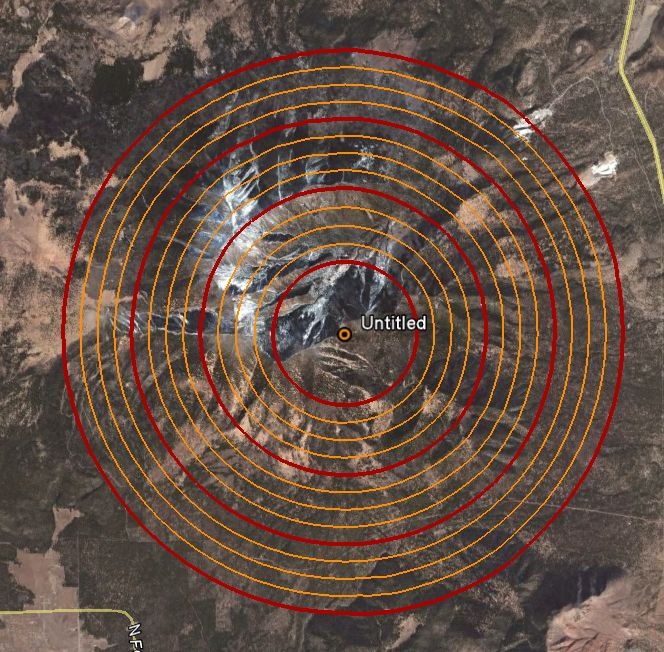
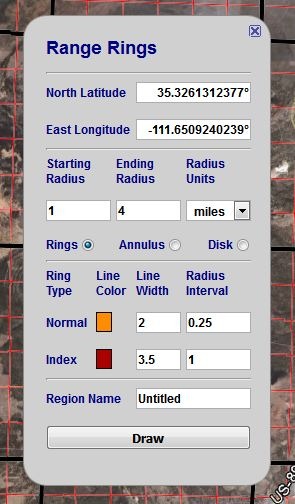
RINGS – Easy range ring generator for Google Earth:
ringssetup

ringsdrawn

Rings show up in a separate folder called “Saved Places”; right-click on that folder and choose “Save As”, and you can save the rings as a static KML file for future use.

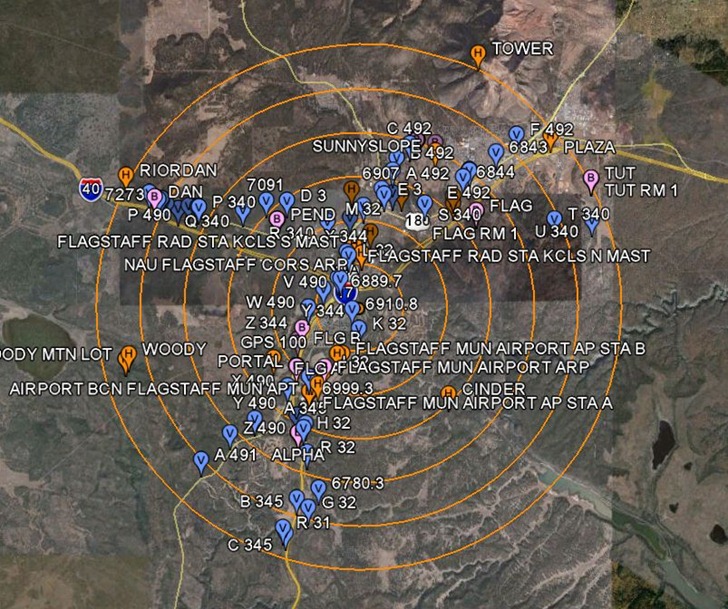
NGSCS – National Geodetic Survey Control Stations. Note that you have to click on Query Setup to specify search conditions, and then check the Search Results box in the Place pane to view them. Unlike the web app, there doesn’t appear to be a way to save a static KML file for a control station, though you can save the network link for that search result.
control

Other available links include a NAD27 to NAD83 shift calculator, a State Plane Coordinate System (SPCS) converter,  and front-ends for the NGS online tools DEFLEC09 (“represents the deflections of the vertical at the surface of the Earth.”),  GEOID09 (“refined hybrid model of the geoid in the United States and other territories”), VERTCON (“NGVD29-to-NAVD88 and NAVD88-to-NGVD29 orthoheight conversions”), and XYZ (“converting between Geodetic Latitude-Longitude-Ellipsoid_ht and XYZ on the GRS80 Ellipsoid”).
Earth Survey Plugin: NGS Benchmarks, PLSS Data, USGS Quad Data And More

A while back, I posted about a free web app from Metzger and Willard that shows National Geodetic Survey control points (benchmarks) near a specific area, and lets you view data for those landmarks. I’ve just noticed that they’ve created a newer web app called the Earth Survey Plugin, running in a Google Earth browser plugin that not only has the same capability, but also adds a bunch of additional features:

  • An NGS Survey Marker capability that works very similarly to the previous app, but now offers the ability to export the data into a static KML file
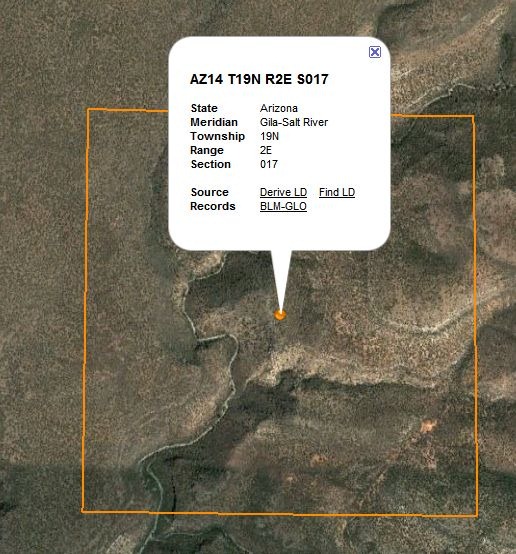
  • A PLSS point geocoder function that either gives you the section data for the point in the middle of the display:

plsspoint

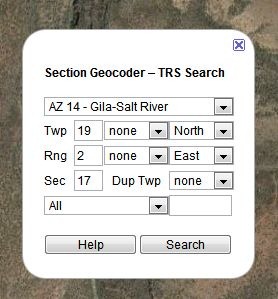
… or lets you enter the PLSS parameters, and find the center point associate with them:

plsslookup

These can also be saved as a KML file.

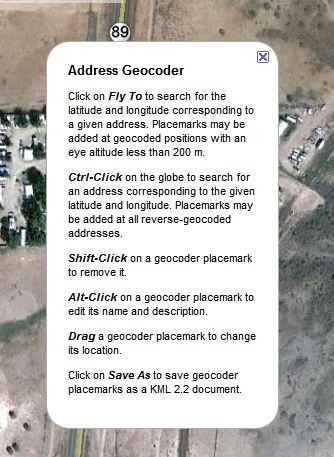
  • A click-to-geocode function:

geocoder

Plus, a set of overlays:

  • PLSS sections, including quadrants and subquadrants:

plssquads

  • Principal meridians:

meridians

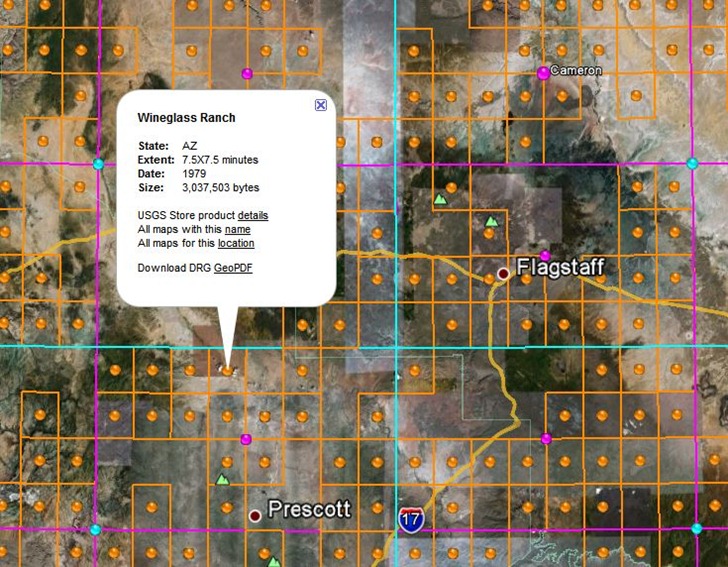
  • USGS topo quad index; orange dots for 1:24K, purple for 1:100K, cyan for 1:250K. Clicking on a dot brings up a pop-up balloon with the name of a quad, and a direct link to the GeoPDF for that quad at the USGS store. Note that GeoPDF quads are not currently available for quads in US National Forests, and that at this time, some states (e.g. AZ, CA) don’t have full topographic information on their GeoPDF quads.

usgsindex

  • Actual USGS topo map views, with the scale depending on your zoom level.


Panorama Generator For Parts Of Europe, Asia And Africa

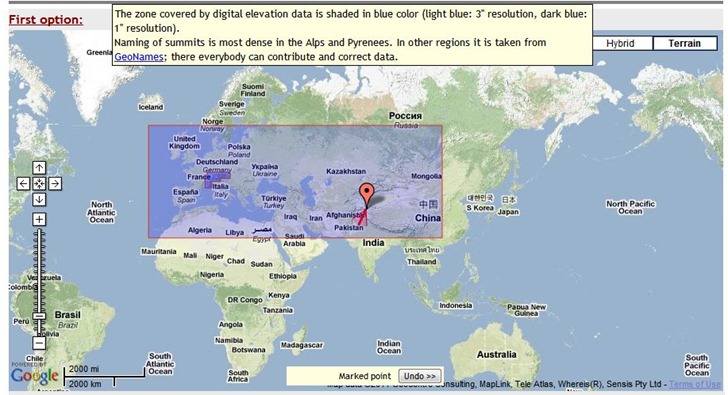
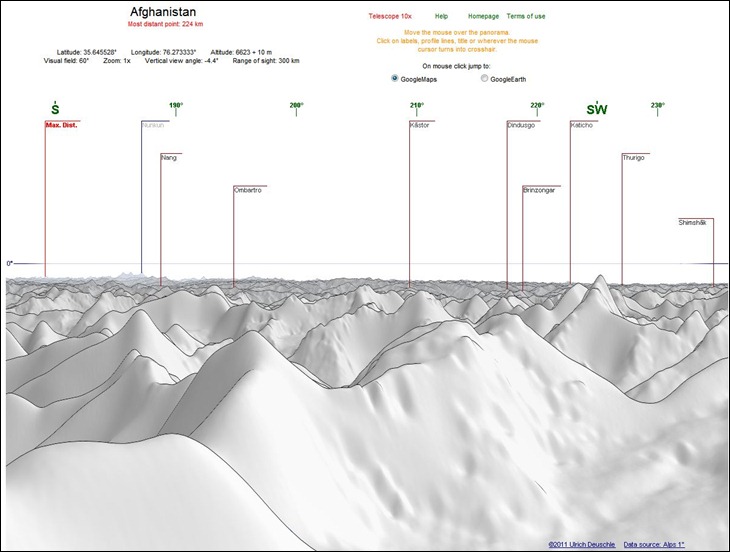
The Generate a Panorama site lets you generate high-quality panorama views, with labeled peaks, for some areas of Europe, Asia, and Africa; moving your mouse cursor over the “Covered areas in Europe, Asia and Africa” link near the top of the page shows the coverage area:

2011-04-26_192531

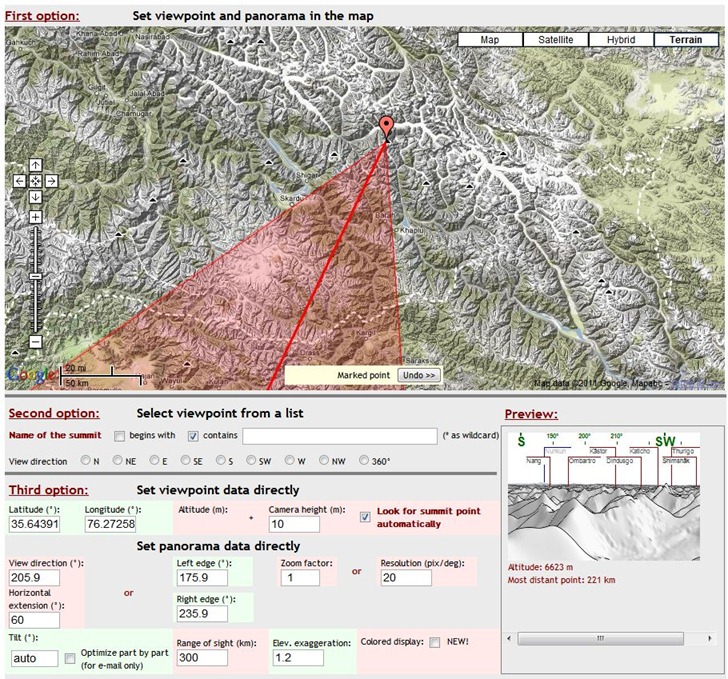
You have three options for setting the peak location:

  • Clicking directly on the map to set the location, then adjusting the direction of view.
  • Choosing peaks from a searchable list
  • Entering the exact latitude/longitude, and also setting camera height, distance, viewing angles and more.

As you adjust the position and parameters, you get a mini-preview of the view at lower-right:

pg_2

When everything is set, you have the option of either emailing a copy of the panorama to yourself or someone else, or viewing it in the browser:

pg_3

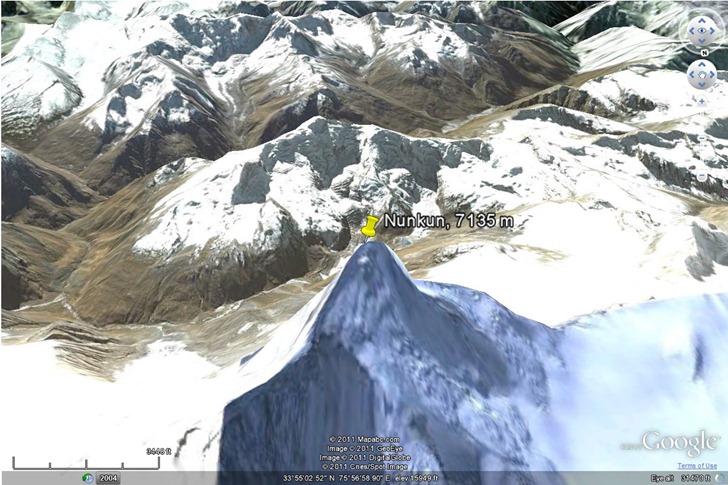
Peaks are clickable, and you can choose to have a peak location highlighted either in Google Maps, or the Google Earth browser plugin:

pg_4

There’s also a “Telescope 10x” option to blow up a section of the panorama, but I couldn’t get that to work.

Data resolution is 1 arc-second (30 meters) for the Alps, and 3 arc-second (90 meters for the rest of the world). Hopefully, the rest of the world will be covered at some point in the future. The panoramas look better than the ones generated by the HeyWhatsThat site, but that site offers worldwide coverage, and additional features like viewshed export to Google Earth.

Via Google Maps Mania.


Monitor Ship Positions And Tracks Real-Time With MarineTraffic.Com

If you’re at all interested in maritime traffic, the MarineTraffic.com site is a terrific resource. And even if you’re not, it’s worth checking out as an example of how you can display real-time data in many different ways on one site using the Web.

mtweb_1

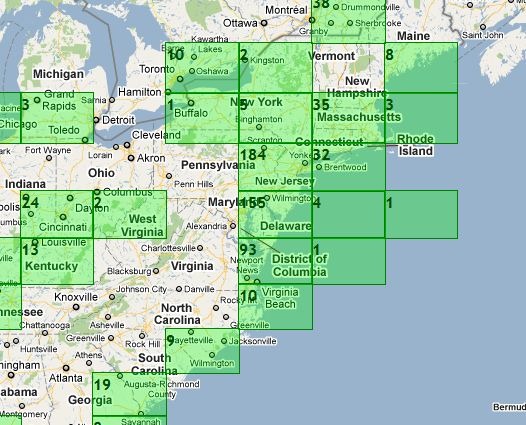
The main map view shows green gridded areas where the site has information on marine vessels; this includes not just the ocean, but also major inland waterways like the Great Lakes and the Mississippi River. Click on a grid square to zoom in.

mtweb_2

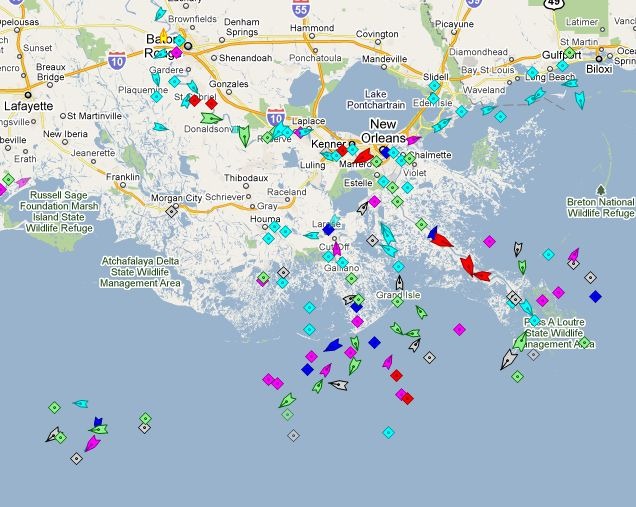
Triangles are ships in motion, with the point showing direction; diamonds are anchored/moored ships, or navigation aids.

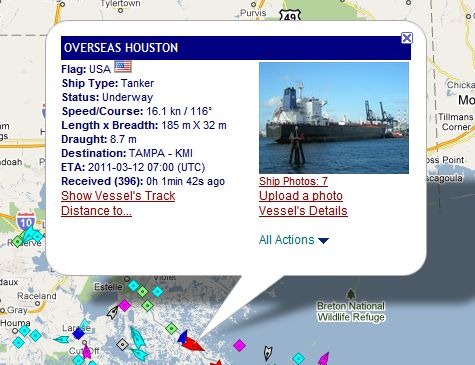
mt_popup

Click on a ship to pull up a popup balloon with more info, and links to even more information.

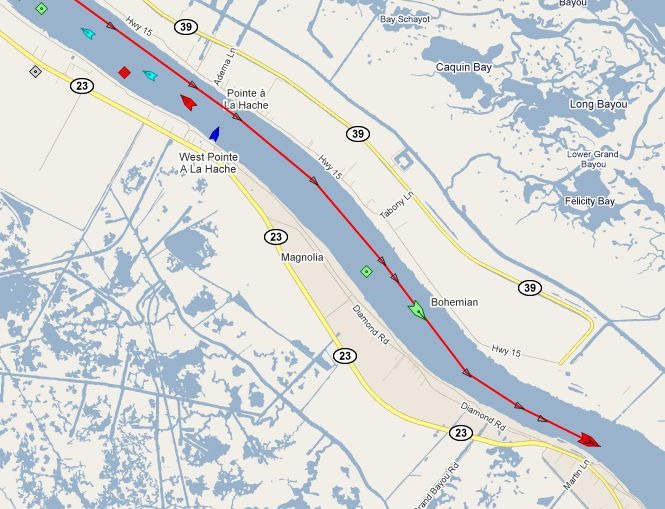
mt_track

Clicking on “Show Vessel’s Track” brings up its recent travel path; passing the cursor over the track brings up time/speed/bearing data for every marked point.

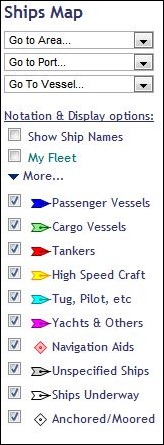
mt_options

The map’s options section shows you the ship color legend, and lets you turn on/off display of various types, as well as showing their names. You can “bookmark” ships into “My Fleet”, and also go to specific ports/areas/ships with the dropdowns.

The Services section offers many other data options, including:

– The ability to embed a map with real-time ship data on your website.

– Apps for iPhone and Android (Android app reviewed today at AndroGeoid).

– A mobile-enhanced website for use on other mobile platforms.

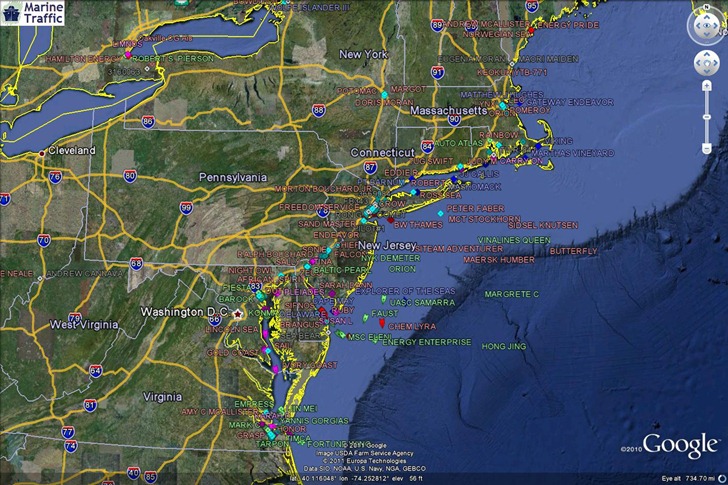
– A KML network link for use in Google Earth.

mt_GE

HT to Goya Bauwens.


Satellite Prediction/Tracking In Google Earth/Maps

The SightSpaceStation website offers some eye-catching satellite position tracking and position web apps. Set your home position in Google Maps (scroll, then click on the home icon near the top):

home

And get a table of upcoming International Space Station (ISS) flyovers near your home location, with “good” ones (good chance of spotting it with your naked eye) highlighted with gold starts:

table

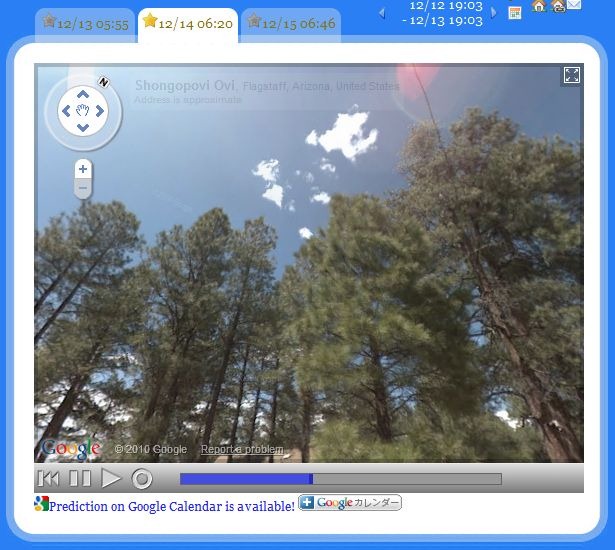
There’s even a link that will let you add the flyover time to your Google Calendar. If Google StreetView data is available for your location, you can play an animated view of the ISS’s sky track in Google View to see where it will track relative to your local landmarks:

track

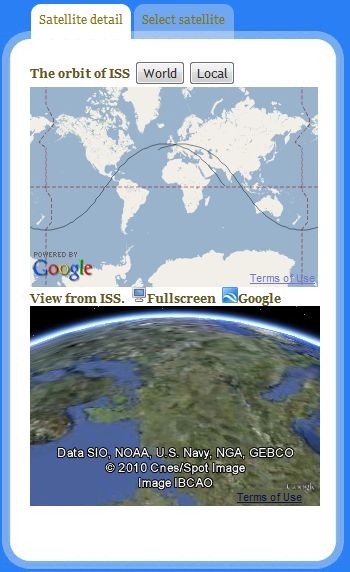
There’s a mini-map screen showing the position of the ISS at that moment, plus a second “out-the-window” view showing what the ISS occupants would see below them as they orbit the earth:

mapscreen

When you play a StreetView flyover, this mini-map will switch to show you the position of the ISS during the flyover, as well as the view out of its window.

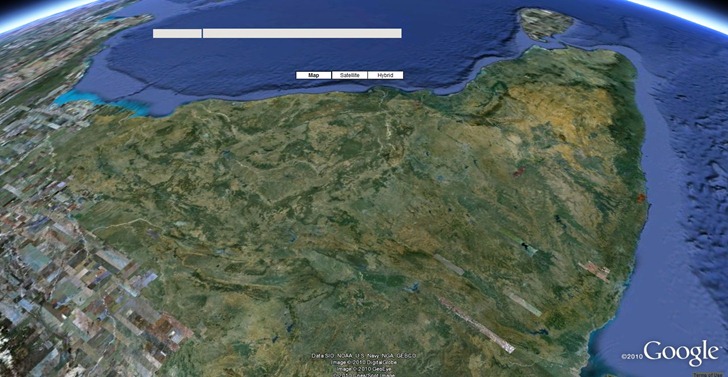
You can load that animated “window view” full-screen into your browser using the Google Earth plugin, or download a KML file which will display it in the stand-alone  (which looks very cool, especially in animated format):

ISS_view

There are a few other satellites you can choose from: Hubble, Resurs, TRMM, UARS.

Site can be a bit quirky, and you may have to reload/refresh it to get out of some screens, and back to the main screen.


Another Earth Updated To Add Historical Imagery

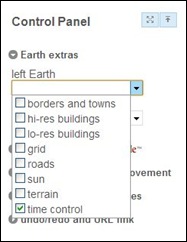
Not long ago, I posted about Another Earth, a site that loads two Google Earth views side-by-side, and lets you either view two locations separately for comparison, or synchronize movements between the two. I said that it was very useful as-is for comparing geographical features, but would be awesome when it added the ability to view historical imagery in one window, and compare it  with current imagery in another. John at Another Earth just emailed me to say that the historical imagery option is now active at the site. You’ll need to make sure that the time sliders are enabled for one or both Google Earth windows in the Control Panel (layout is slightly modified from the previous version):

aecp

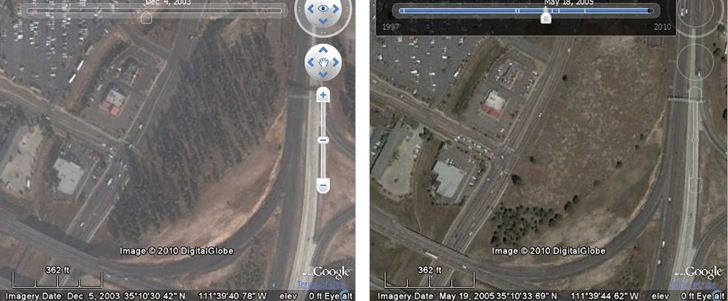
Then move the time sliders to an available imagery date; tick marks in the slider panel mark dates with available imagery. In the sample below, I compare a wooded knoll on the left from 12/2003 with a later view in 5/2005, after the owner had illegally chainsawed through the tree trunks to kill them, and clear out the lot:

flagcompare

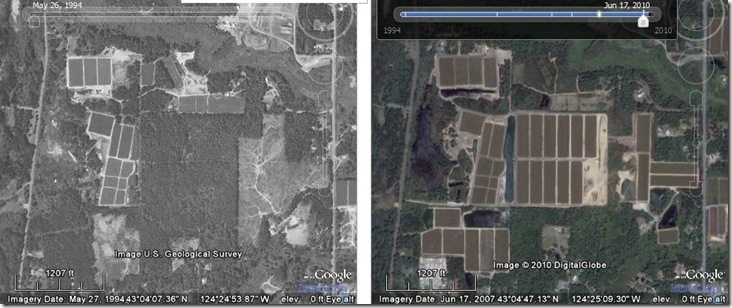
Here’s another comparison near Bandon, Oregon, showing growth of cranberry bogs  between 1994 and 2010:

bandon

You’re restricted to whatever imagery Google Earth has available for that area for a particular time, which for much of the US doesn’t seem to go earlier than the 1990s. Still, this is pretty awesome as-is for looking at man-made landscape changes or the effects of natural disasters, and will only get better with time as Google adds more historical imagery to their database.


Two Javascript Mapping Libraries

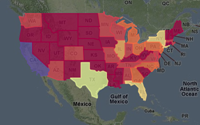
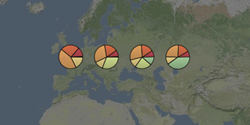
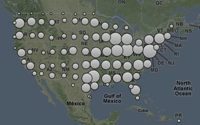
Cartographer: Free Javascript libraries (MIT License) for generating basic thematic maps.

ex_choropleth
Choropleth
ex_pies Pie charts ex_cluster
Cluster

Links to additional live examples at the website. You can hard-code data values, or retrieve them from an online source like a Google Spreadsheet.

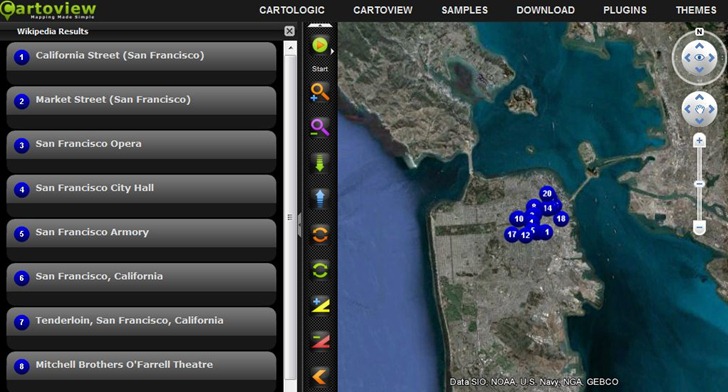
Cartoview: Open source software that “makes building and editing maps a breeze…”. I wouldn’t go quite that far – I think you’ll need quite a bit of experience with Javascript, Google Maps and webservers to get this up and running. But there’s a substantial amount of help available, including tutorials, online help files, and a user forum. There are also a number of online demos, with links to downloadable source code for the demos to help you figure out how to do stuff. I gotta say, some of the demos look very impressive, like this Google Earth plugin view that lets you plot points/data from online resources (Wikipedia, Yelp, Foursquare, Twitter, etc.), with user-definable interface styles:

cartoview


Two Google Earth Views In One Browser Window With Another Earth

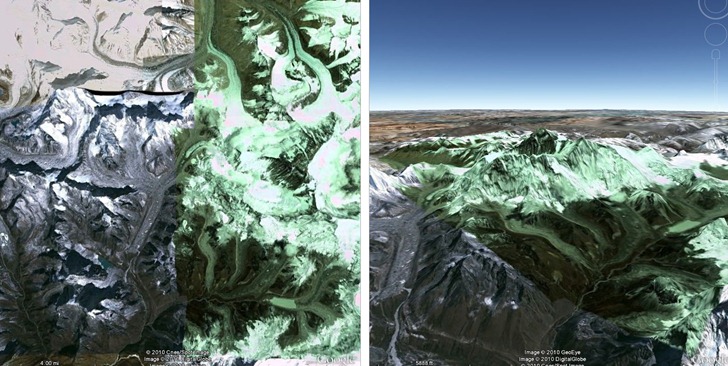
Another Earth puts two Google Earth plugin windows into a single browser view, and lets you control the view in each either independently, or synchronized with each other. So you could have one view from the top, and a second from an angle, like Mt. Everest:

everestcomparison

A control panel lets you synchronize/copy parameters like location/heading/tilt/altitude from one view to the other, choose which overlay layers to display, and create a shareable link for a particular view comparison you’ve created:

ae_controlpanel

Tip: Turn on the “terrain” overlay right away for both views; default is off, so that the Earth is flat.

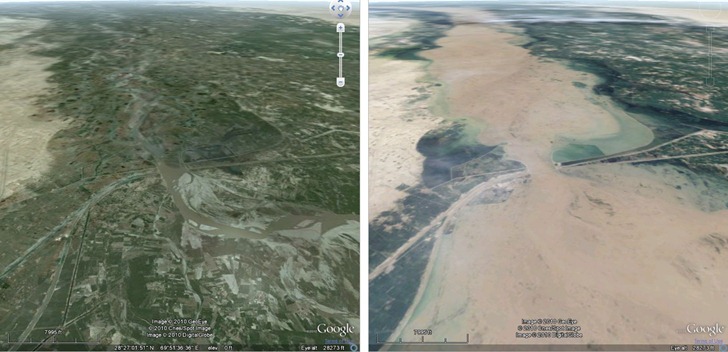
This is a great tool as-is for comparing different geographic features. It will become really awesome when, as the site creator indicates will happen in the future, you can use “historical imagery” as a layer; you’ll then be able to compare location views at different times directly. He’s got a sample subsite already up comparing imagery taken during the recent enormous flooding in Pakistan, compared to pre-flood imagery. I heard the floods were huge, but it wasn’t until I saw this comparison that I started to really comprehend how huge they were:

pakistan