blankblank blank


Archive for the 'KML' Category Page 2 of 16


Online Elevation Profiler

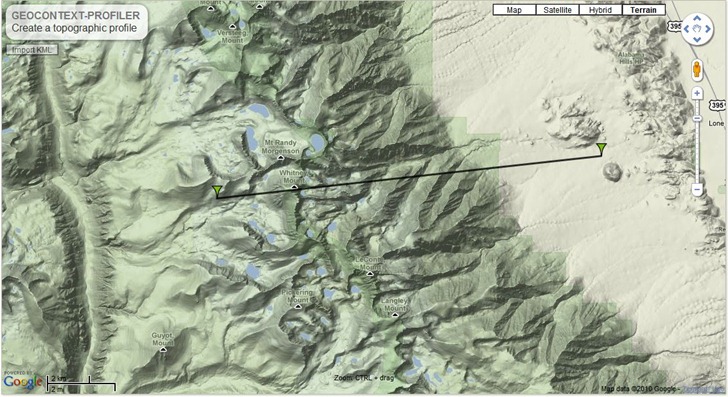
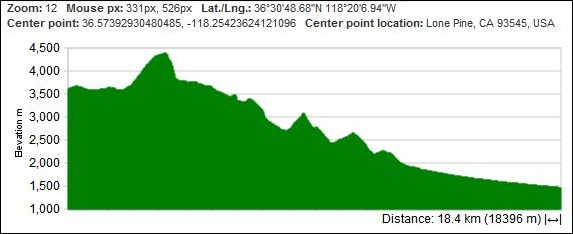
Krystian Pietruszka emails about his new Geocontext Profiler site, based on the new Google Maps API version 3. Place two markers on a Google Maps view by clicking, and get the elevation profile between them:

geocontext

geoprofile

You can add as many additional markers as you want in any direction; to fine-tune a marker position, just click and hold on it, and drag it to the desired spot. You have multiple options for the lines between points:

  • Direct – Straight line between points
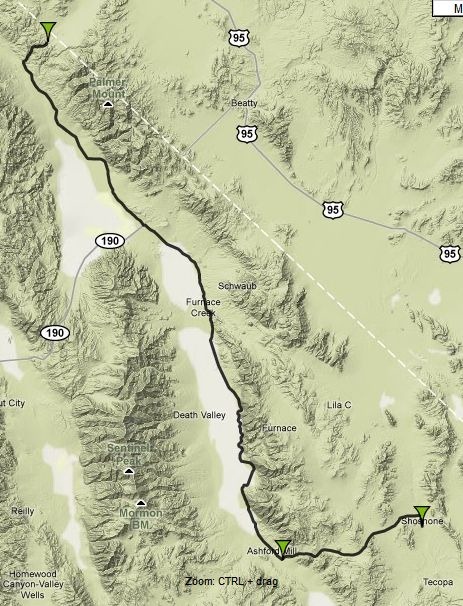
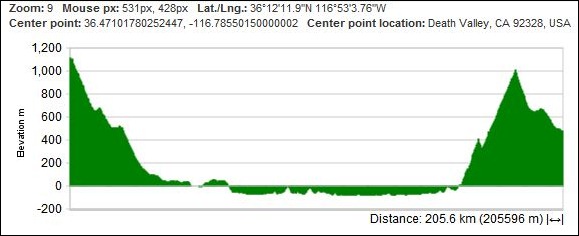
  • Driving – Elevation along roads from point to point (like this preset example for Death Valley):

deathvalley

deathvalleyprofile

  • Bicycling/walking

Click on the Geolocation IP link at right to jump to your local area; click on the double-arrow icon in the upper right corner to go to full-screen-width for the app (and back again). You can also link to a profile, or embed it on your site:

Note: The “Import KML” link in the upper left of the map will let you load and display KML data on the map, but doesn’t create an elevation profile between points or along a line.


Another KML Circle Creator

Both this site and KML-Circles appear to be down; try the GE Path program as an alternative.

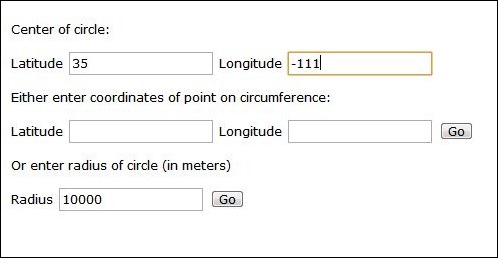
Posted a long time ago about the KML-Circles site, which lets you generate polygons/quasi-circles centered around arbitratry points in KML format for Google Earth and Google Maps. Lots of options at that site, perhaps too many if you just want a simple circle. For that, there’s the very-stripped-down KML Circle Generator site. Enter the center point for the circle in lat/long, and either the desired radius in meters or a lat/long position you want the circle to pass through:

KMLcirclegenerator

Press the Go button, and get a link to the KML file:

link

Depending on how your browser is set up, clicking on the link will either download it to your computer, or open it automatically in Google Earth. Right-clicking on the link and choose “Save As” is the safest, as it will definitely download the file to your computer. Open it in Google Earth:

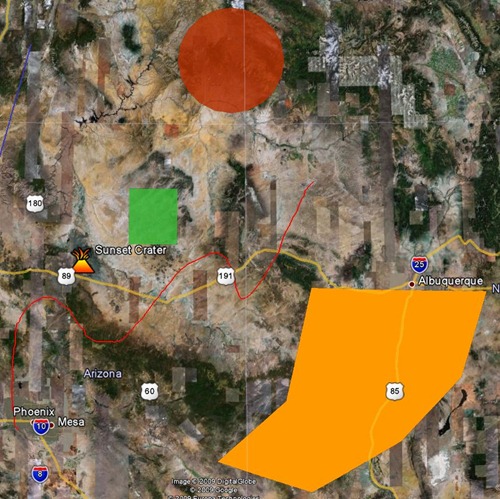
image

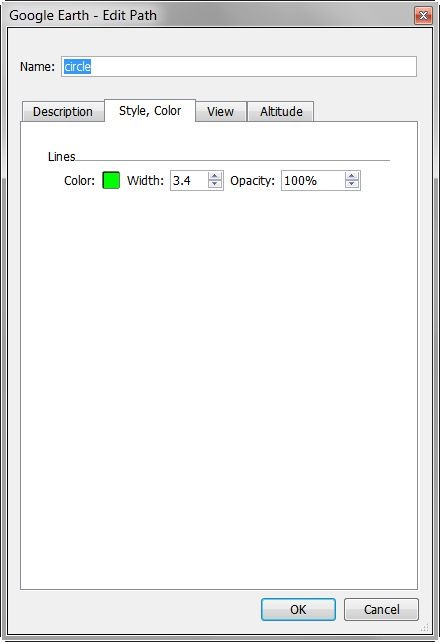
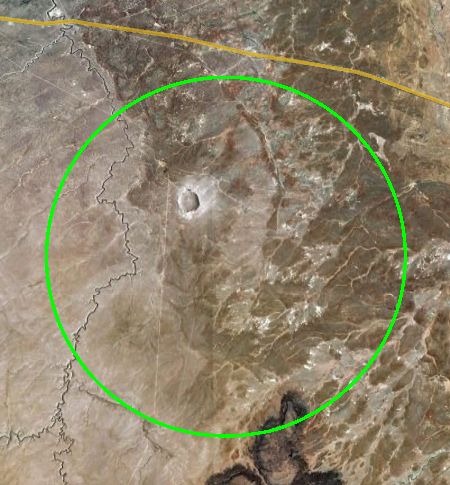
Default is a red circle; if you don’t like that, you can always right-click on the KML file listing at left, choose Properties, and change the style to whatever you want:

style

imagegreen

BTW, that big hole in the ground inside the circle is Meteor Crater, just outside Winslow, AZ.


Convert An Excel Address Spreadsheet Into A KML File (And Then Into A Geocoded CSV Text File) With KMLGeocode And KMLReport

KMLGeocode (available here under the Google Geocoder listing) takes an address file in Excel (or XML) format, and creates a Google Earth KML file that plots geocodable addresses in the correct position. Load an address XLS file into the program (like this sample data also available on the download page):
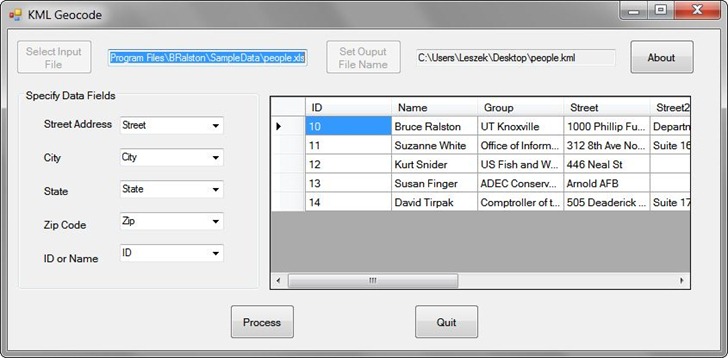
KMLGeocode

You have to specify the column names that contain the key address fields required for geocoding, as well as the output KML filename. Once done, create the KML output file and open it in Google Earth. Addresses that could be geocoded will be plotted with orange pushpins:
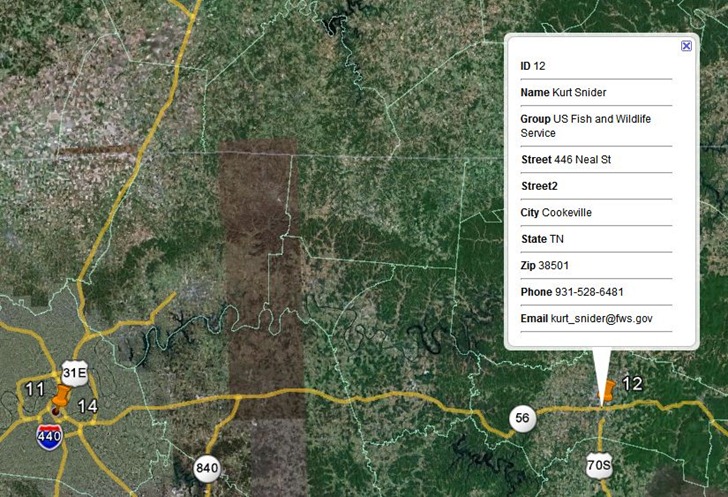
geocoderesults

Clicking on  pushpin will bring up all the data fields for a record in the spreadsheet, not just the specified ones. Addresses that couldn’t be geocoded are given yellow pushpin designations, and will either show up plotted in a general location, or not plotted at all in Google Earth (though they will be listed in the Place pane under the KML file listing:
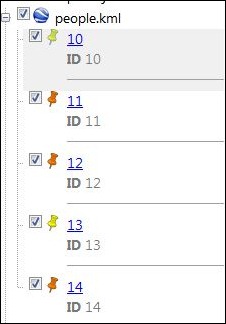
geocodeplaces

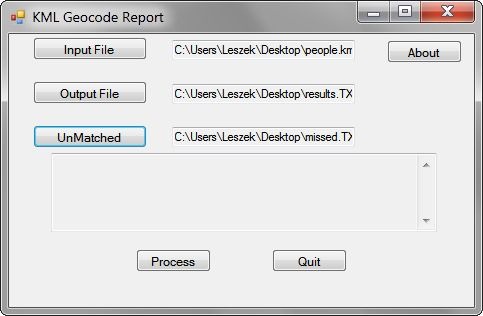
To embed the actual geographic coordinates for each of these addresses, right-click on the KML file listing (people.kml in the above example), and save it as another KML file with a different name. You can now open this different KML file in the KML Geocode Report program:
geocodereport

Specify the name of a text output file; this output will be a spreadsheet-readable CSV file that contains the original spreadsheet data with the longitude and latitude of geocodable addresses appended at the end as X and Y coordinates:


ID,Name,Group,Street,Street2,City,State,Zip,Phone,Email,X,Y
 11, Suzanne White, Office of Information Resources, 312 8th Ave North, Suite 1600, Nashville, TN, 37243, 615-253-4799, suzanne.white@state.tn.us,-86.784031,36.164133
 12, Kurt Snider, US Fish and Wildlife Service, 446 Neal St, , Cookeville, TN, 38501, 931-528-6481, kurt_snider@fws.gov,-85.497903,36.138056
 14, David Tirpak, Comptroller of the Treasury, 505 Deaderick St, Suite 1700, Nashville, TN, 37243-0277, 615-401-7820, david.tirpak@state.tn.us,-86.781603,36.165238

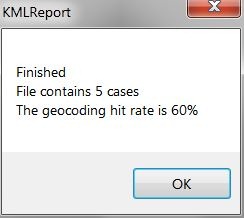
The “UnMatched” file is supposed to contain the non-geocodable addresses in KML format (at least, according to the PDF manual for these programs), but it didn’t show up for the sample data when I tried it. When you “Process” the files, in addition to the output file above, you’ll get a pop-up telling you the overall geocoding success percentage:
matchpercent

Note: When installing both programs, the installation directory is listed simply as “C:\Program Files\”; however, unless you specify the new name, it is installed in the directory “C:\Program Files\BRalston”, and “BRalston” is the folder in the Start Menu where you’ll find the program shortcut icons.
GISCloud – An Online Geographic Information System Application

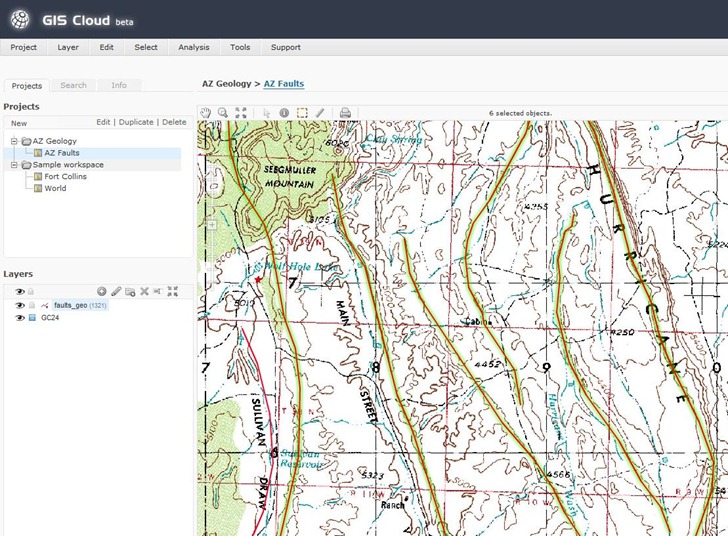
I’ve been playing around a bit with GISCloud, a web-based GIS program. Looks interesting, and promising, but still has serious limitations. Feature set includes:

  • Raster and vector data display
  • Vector layer import and editing, including shapefiles, MapInfo, KML, tab-delimited and GPX
  • Built-in datafile coordinate reprojection; recognizes prj files, and lets you select the output coordinate system (including the one for your current project)
  • Advanced GIS analysis tools, including buffering, spatial selection by analysis, layer comparison (e.g. intersection), and area calculations.
  • Export vector data layers in shapefile, MapInfo, CSV or KML; this makes it a handy online format converter.
  • Share map editing with other users (or just publish it for viewing)
  • Easy-to-decode classic-looking GIS interface:

GISCloud

On the downside:

  • Only data layers imported into or through a PostGIS connection can be used for analysis and editing. I’m not up on PostGIS so I couldn’t test these functions, and none of the data sample sets have PostGIS data, either. You can apparently upload data and import it into a PostGIS database, though.
  • Uploading files can take a while (though they’re saved locally); GISCloud recognizes files in compressed archives, so you’re best off zipping up your data before you upload it.
  • For PostGIS data, I suspect that upload times are going to limit the size of the vector/database layers you can use.
  • Apparently no thematic (attribute-based) display colors yet; this is a major drawback.
  • Raster imagery updates during zooms can be slow.
  • Not all raster image types supported (e.g. 8-bit indexed GeoTiffs don’t work, 24-bit do).
  • It’s not exactly the zippiest GIS platform I’ve ever worked with.
  • It’s Flash-based, so Flash haters and iPad users should avoid, and everyone should expect CPU/performance/crashing issues. Flash 10.1 is supposed to be out soon, and supposedly will address some of those problems.

An interesting early effort in cloud-based GIS, and I’ll be watching its development. But unless you have access to, and/or experience with, PostGIS, of limited utility for now. And I don’t expect to see cloud-based GIS replacing dedicated GIS programs any time in the near future – too slow, and too limited.


Draw GPX Data Directly On Web Maps Using The GPS Visualizer Freehand Drawing Tool

I’ve posted recently about ScribbleMaps and ScribbleMaps Pro, web apps that let you draw features on a number of web maps (like Google Maps, OSM, and ESRI), and export the data in GPX format for upload to a GPS. Stopped by the GPS Visualizer website the other day, and just noticed that they have a similar application now, the GPS Visualizer Freehand Drawing Tool. On the down side, it doesn’t have nearly as many tools, editing options and output options as ScribbleMaps; on the plus side, because it doesn’t have a large number of tools and options, it’s easy and intuitive to use. And in addition to Google Maps and OSM Maps, it offers a number of background map options that ScribbleMaps doesn’t:

Continue reading ‘Draw GPX Data Directly On Web Maps Using The GPS Visualizer Freehand Drawing Tool’


Natural Earth Data In Google Earth

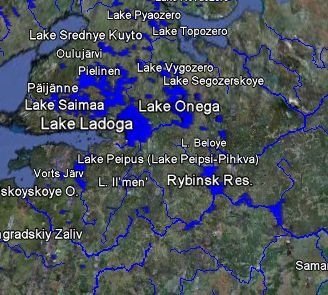
Last week, I posted about the new Natural Earth datasets, free medium-scale vector data for the earth to go along with the previously-available Natural Earth physiographic raster data. The Google Earth Library now has a KML network link that lets you view much of this data in Google Earth as layers, like here with lakes and rivers:

lakesrivers

Obviously, most of these features will be visible in Google Earth as soon as you zoom in, but these datasets let you view features with names at lower zoom levels, and more distinct colors. Plus, this offers a quick preview of the data available from Natural Earth, so you can see whether it meets your needs for use in a GIS or mapping program in shapefile format. There’s also an overlay with the raster physiographic imagery:

him

All of the data is in KML network links in subfolders of the main link, and some datasets will take a while to load. It’s also probably a good idea to not check the box next to the main network link, as this will load all the data into Google Earth, which will take a while.


Create KML Range Circles, Arrows And Wedges With An Excel Macro

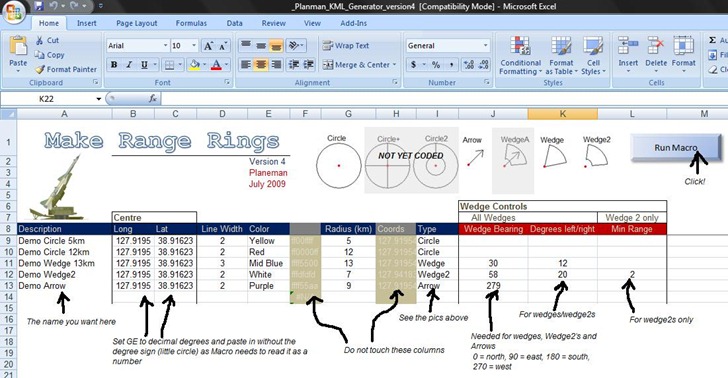
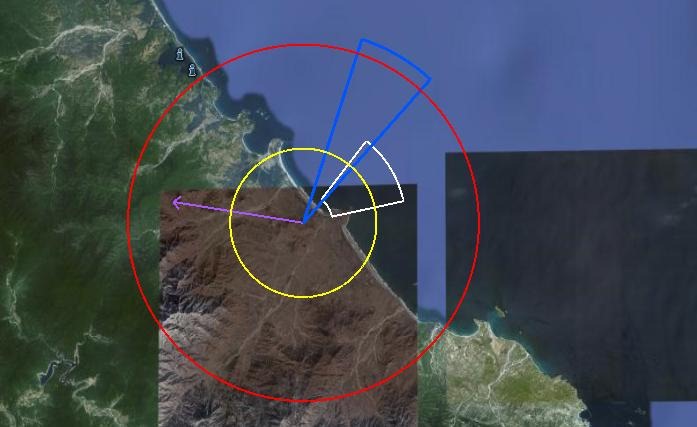
I’m currently running OpenOffice only, so I can’t try it out, but “Planeman” has created an Excel macro that will create KML range circles, arrows and wedges for a list of decimal latitude/longitude points. Should be able to create these for hundreds or even thousands of points simultaneously. Pictures are from Planeman’s description. Excel spreadsheet view:

mvsppi

And a view of the results from the sample data in Google Earth:

23wqxhc

Download the spreadsheet macro at this link; be sure to scroll down to the bottom to get the latest version. From the picture above, looks like additional features are coming soon.


Draw Freely On Google Maps, Export In Multiple Formats

ScribbleMaps is one of the slickest Google Maps apps I’ve ever seen. Draw and/or place any of the following on a Google Map view:

  • Freehand lines
  • Straight lines
  • Circles
  • Rectangles
  • Arbitrary shapes
  • Text
  • Images (needs a web link to the image)
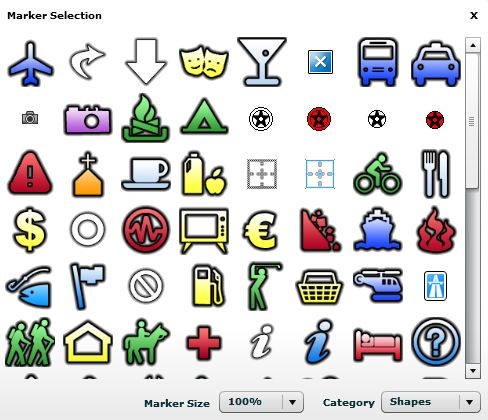
  • Standard Google Map/Earth placemark icons (select from multiple sets):

placemarks

You also have control of the color, opacity and line thickness from the toolbar, along with the ability to search for locations:

scribblemapcontrols

Once the shapes are created, you can move them, modify them by shifting vertices, rotate them, or erase them. Once done with your map, you have multiple export options:

  • JPEG
  • Print directly from browser
  • Embeddable widget (no Google Maps API key required):

  • Facebook map
  • Regular Google Maps view
  • Google Earth plugin (though this didn’t work for me)
  • KML file (for viewing in Google Earth)

scribblemapsGE

  • GPX (for export to your GPS); only exports points and lines, the only geometric shapes that GPX files support

You can also save your map for future editing, and get a dedicated web link for it; you choose a password for it so that only you can edit it, or delete it later.

Very slick, and very cool; I’m putting ScribbleMaps into my main bookmarks list.