blankblank blank


Author Archive for Leszek Pawlowicz Page 3 of 79


Online Resources For Magellan Triton GPS Owners

The huge number of online support resources for Garmin handheld GPS units dwarfs the number of comparable sites for info and data for the Magellan Triton GPS line. Still, there are a few very useful sites to bookmark if you own this raster-compatible GPS unit.


The Big List Of Image Registration / Georeferencing Software

If you want to use a raster map image in a GIS program, it needs to be calibrated so that the software will know the geographic position of every pixel in the image. This calibration data can be embedded in the file, as in GeoTiffs and MRSID files, or external as in worldfiles. If you have a raster map image which doesn’t include this calibration data, you’ll need to create it yourself; this process is called  “image registration” or georeferencing. There’s a number of free programs that can perform this function, and I’ve put together a list of some of them below; if you know of others, please let me know and I’ll add them. And if I’ve included a program that doesn’t do georeferencing (very possible, since I haven’t used all of them), let me know that as well and I’ll drop it from the list.

One thing to keep in mind: some of the programs only work correctly if the map image is already in a specific map projection like UTM or geographic, and you use the same coordinate system to georeference the image. As a general practice, it’s always best to use the same coordinate system the map was created in to georeference it. For example, if you have a map in the UTM projection, and use geographic coordinates to georeference it, the resulting calibration is unlikely to be accurate over the entire map (unless you’re at the equator). Some programs let you warp the map image to get it to match the coordinate system, a process known as “rubber-sheeting”; this is especially useful for those maps that aren’t drawn accurately, like old or hand-drawn maps, or maps created in no-longer-used coordinate systems.

BTW, I haven’t used most of these for georeferencing – GlobalMapper is my program of choice for this function. It’s not free, or even cheap, but it works great for georeferencing, including rubber sheeting. For beginners, I’d suggest looking at MapWindow, qGIS or MicroDEM first before going on to the more advanced software.

CHIPS For Windows

DIVA GIS

e-Foto

GRASS

gvSIG

HyperCube

ILWIS

Image Georeferencer

LandSerf

MapWindow

MicroDEM

MicroMSI (link may be dead)

Opticks

OSSIM

qGIS

QLandKarte

RasterStretch

Regeemy

SAGA

SavGIS

Spring GIS

TransGen

xBit

Online map rectification tools

MapWarper

Metacarta Map Rectifier

NYPL Map Rectifier

Old Maps Online Georeferencer (in development)


Mapping Anthropogenic Biomes

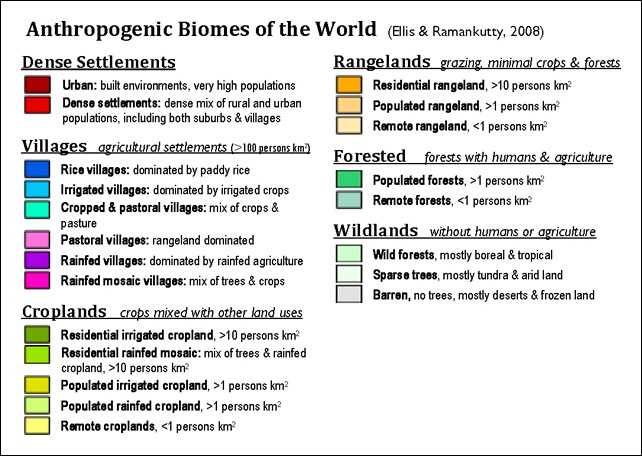
Yesterday’s post was about a site that categorized biomes with very fine divisions based on vegetation, soil moisture, surface lithology, etc., all with the underlying concept that for most areas this was a representation of an actual natural biome. The creators of the concept of anthropogenic biomes go in a different direction; they believe that the impact of man upon the natural landscape has been so profound, with only about 11% of the earth’s surface still truly6 wild,  that most of the biomes of the world must be described by at least partially including the effects of mankind. They’ve broken down biomes into just 21 categories:

Anthro_biomes_legend_v2

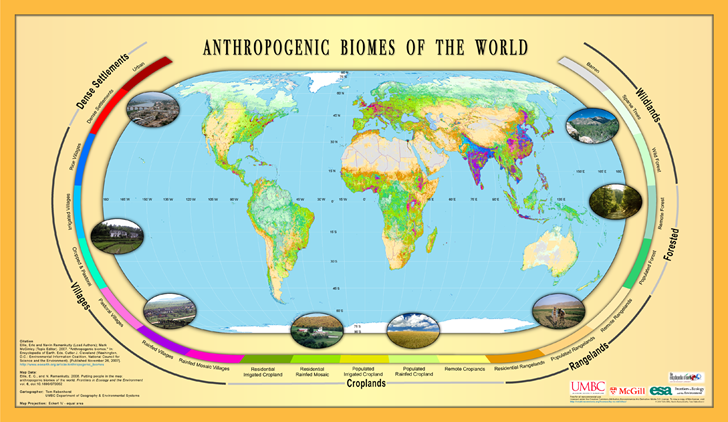
And created a world map using these categories:

anthrome_map_v1

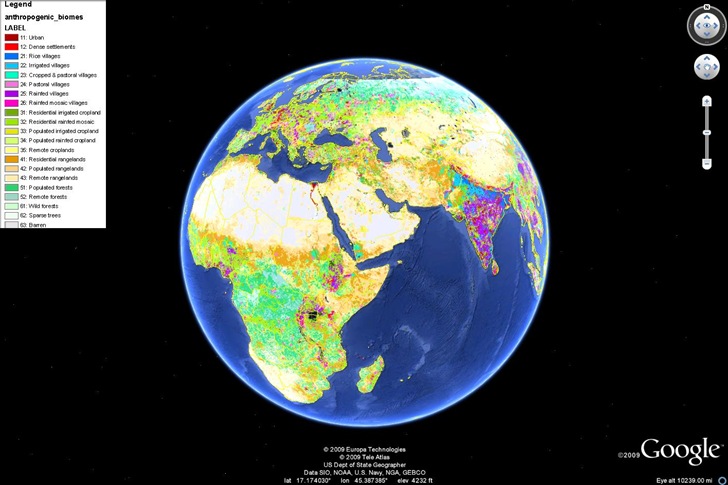
You can download a PDF of the above image, an ArcGrid file for use in ArcGIS, or a KML file for viewing in Google Earth on this page. Viewed in Google Earth:

anthrobiomes

Also available are map viewers for this data in Google Maps and Virtual Earth (latter didn’t work on Firefox for me).

You can watch a Discovery Channel video on the concept of anthropogenic biomes here.

Via Highly Allochthonous.


High-Resolution Terrestrial Biome Data

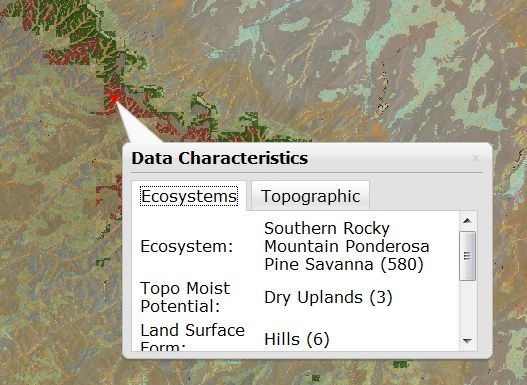
The USGS Global Ecosystems Viewer (background info here) lets you view terrestrial biome data in very fine detail, with extensive categorization levels. Coverage is currently limited to the US, but the background page indicates that the rest of North America, South America and Africa are currently being worked on. Click on the map, and get a popup detailing vegetation classification, lithology, moisture, terrain, and other data:

biomepopup

For this example, the Ecosystems data is:

Ecosystem:
Southern Rocky Mountain Ponderosa Pine Savanna (580)

Topo Moisture Potential:
Dry Uplands (3)

Land Surface Form:
Hills (6)

Surficial Lithology:
Non-Carbonate Residual Material (3)

Isobioclimate:
Upper Supramediterranean Dry (51)

and the Topographic data:

Elevation:
2248 meters

7375 feet

Slope:

Aspect:
102° (E)

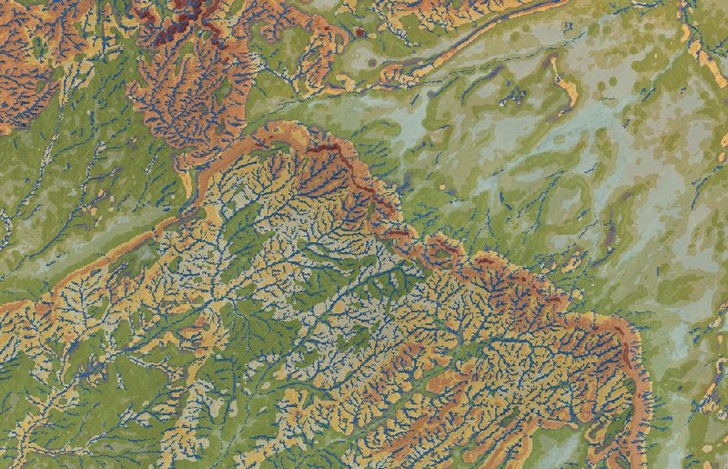
You can also do a colored plot of any of the ecosystems parameters by themselves, like this one of the Surficial Lithology:

surfaceforms

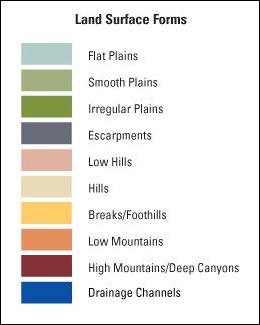
With a button to bring up the legend in a pop-up window:

formslegend

Background imagery can be satellite photos (as in the example above) with and without borders and placenames, topographic maps (USGS 100K), or no background at all. Finally, you can order data for your current view for download in georeferenced format (UTM, Albers or geographic projection) in ArcGrid, GeoTiff or ERDAS IMAGINE formats. Data will be prepared and available for download via FTP; you get email notice of this, but there’s also a status update page you can use. When I tried it, the data was ready for download in less than five minutes.

Via Spatial Sustain.


Simplified Scree Shading For Maps

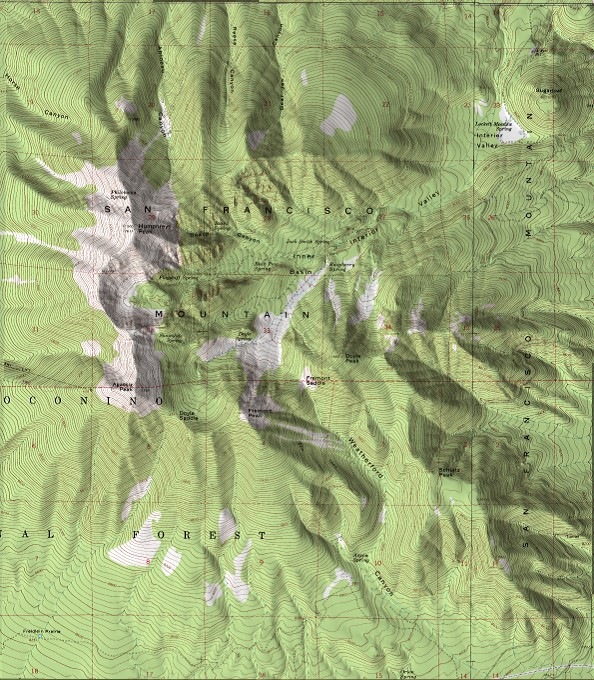
While good shaded relief is still a cartographic art (see the Shaded Relief and Relief Shading websites for more info), programs like 3DEM, MicroDEM and others can create decent shaded relief effects using digital elevation models (DEM) to shade raster graphic files. Here’s a sample USGS topo map shaded using 3DEM:

toporeliefshaded

Another style of relief shading is scree shading, also called Swiss-style; it involves drawing small dots representing rocks on maps to provide texturing. In the past, there’s been no way to automate this process, so the only way to do it was by hand, a slow and time-consuming process. Bernhard Jenny of the Swiss ETH has recently introduced Scree Painter, a Java program (Windows, Mac and Linux) that, while not exactly fully automating the process or making it simple, at least makes it far more practical. Mandatory data required includes:

  • A mask to define the size of stones (raster grayscale image with worldfile); darker areas will have larger stones
  • A DEM (ESRI ASCII Grid format) to define gullies
  • Shapefile polygons to define where scree stones will be placed
  • A raster obstacle mask (with worldfile) where black defines areas where no stones will be placed; sometimes this can be the main raster map image

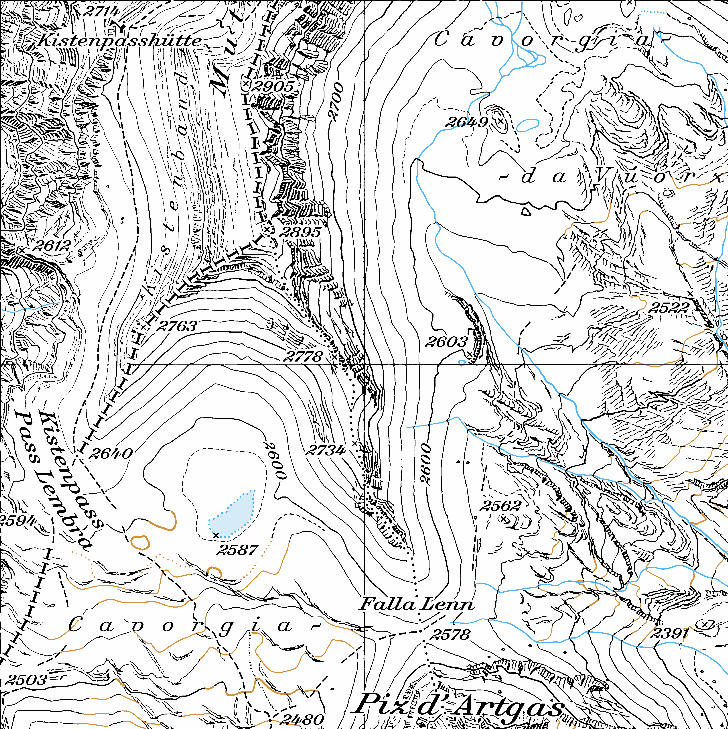
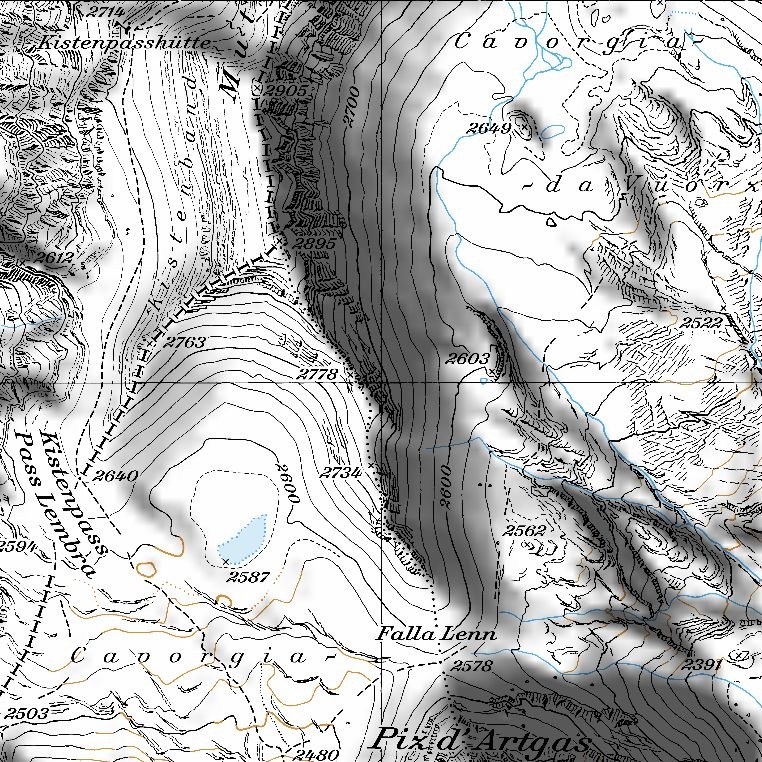
Optional data includes gully lines, a background reference image, and gradation and large stones masks. Once the data is loaded in, sliders let you vary parameters that change the density, shading and shadowing of stones. You can download a sample dataset to play with from the website. Here’s the original map:

original

Using a shaded relief program, I could convert this into:

reliefshaded

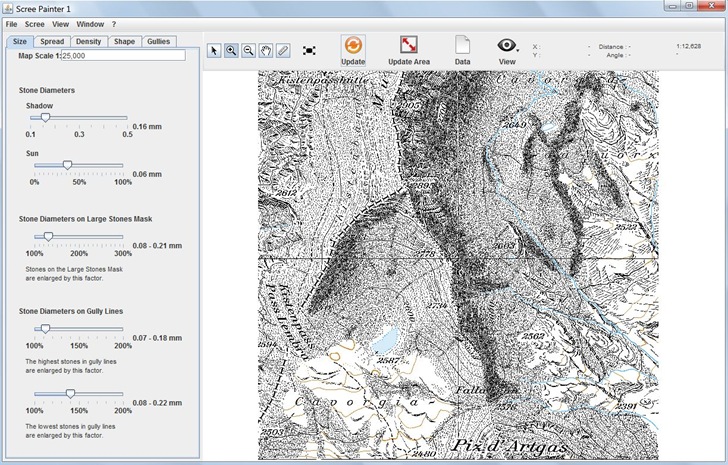
But by loading it into Scree Painter, and randomly selecting some  parameters, I can get this:

screepainter

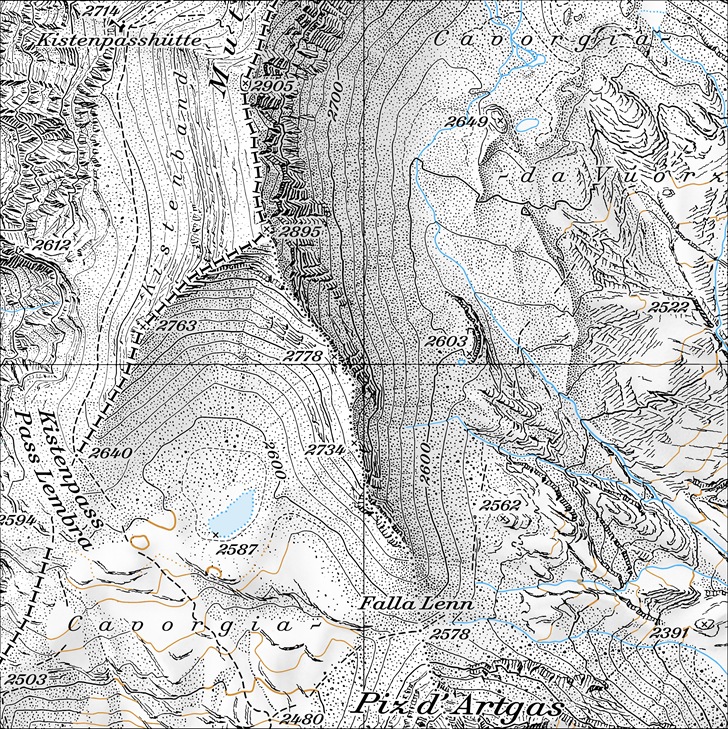
Not every good, but then I didn’t try very hard. The sample data includes a reference image that shows what the program is capable of:

reference

Unfortunately, it doesn’t appear as though you can export the full original map with generated scree and gullies directly. You can export the scree and gully data in a variety of vector and raster format, but you then have to re-combine this data with the original map using a GIS or graphics program to get a result that looks like the one above. Hopefully the author will add the option to export the full image in a georeferenced format in the future.

Via Kelso’s Corner.


Free Sampling Design Tool Extension For ArcGIS

The Sampling Design Tool is another free ArcGIS extension from NOAA’s Center for Coastal Monitoring and Assessment, the source of the Habitat Digitizer Extension I posted about last week.  Key features (from the PDF manual):

  • Spatial sampling –sampling and incorporation of inherently spatial layers (e.g.
    benthic habitat maps, administrative boundaries), and evaluation of spatial
    issues (e.g. protected area effectiveness)
  • Scalable data requirements – data requirements for sample selection can be
    as simple as a polygon defining the area to be surveyed to using existing
    sample data and a stratified sample frame for optimally allocating samples
  • Random selection -eliminates sampling biases and corresponding criticisms
    encountered when samples are selected non-randomly
  • Multiple sampling designs – simple, stratified, and two-stage sampling
    designs
  • Sample unit-based sampling – points or polygons are selected from a sample
    frame
  • Area-based sampling – random points are generated within a polygon
  • Analysis – previously collected data can be used to compute sample size
    requirements or efficiently allocate samples among strata
  • Computations –mean, standard error, confidence intervals for sample data
    and inferences of population parameters with known certainty
  • Output – geographic positions in output simplifies migration to global
    positioning systems, and sample size estimates and sample statistics can be
    exported to text files for record keeping

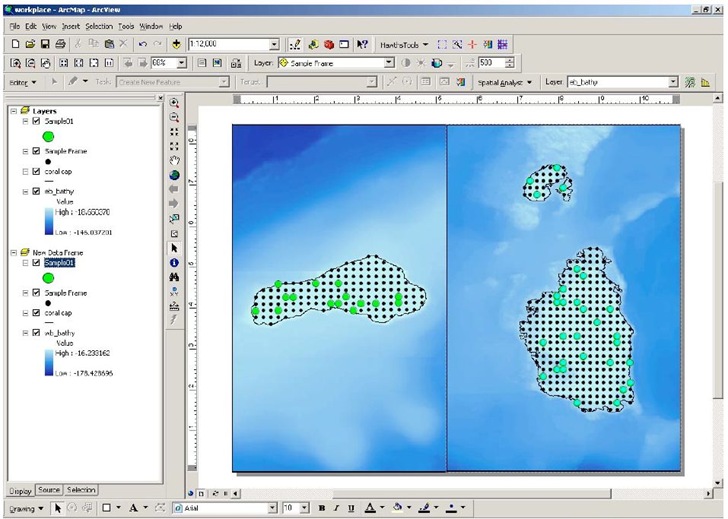
Example of random sampling (from the manual):

randomsampling


Free Vector Country Borders, Administrative Boundaries, And Soon More

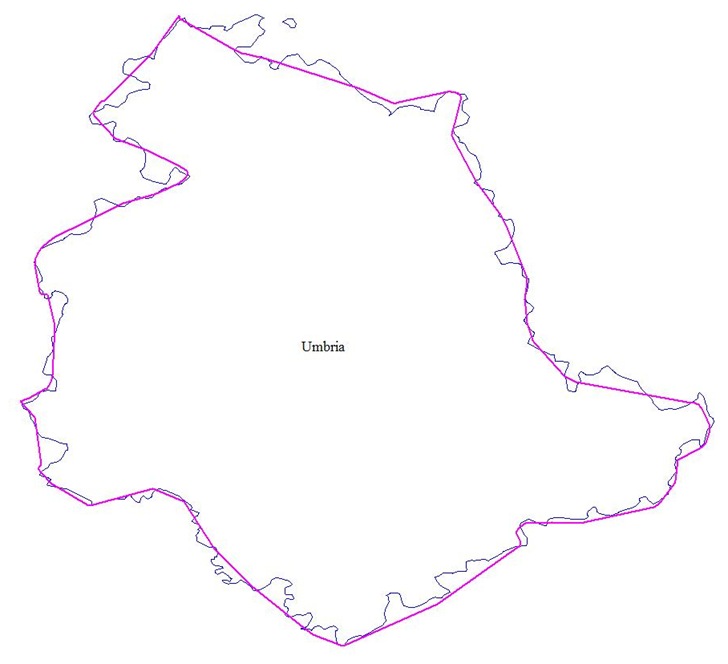
Wish I’d known about this site when I was hunting for a high-res border outline for the province of Umbria in Italy. The Global Administrative Boundaries website offers free vector GIS data for country borders and administrative areas within those borders. Data is available in geographic coordinates (lat/long), WGS84 datum, in multiple formats:

Coverage is worldwide for level 1 data (country borders), but diminishes as you go down as far as level 4 (sub-administrative units), though for the latter there are some countries for which such a data level isn’t relevant. You can see maps of current level coverage here, and missing data will likely be added in the future. Data is licensed under Creative Commons for the US; other unspecified terms may apply for the rest of the world. Here’s the Italian province of Umbria, with the best free data I could initially find plotted in purple, and the high-res GADM data in blue:

umbria

Via Slashgeo.

Just around the corner, scheduled for unveiling at the October 2009 NACIS conference, is Natural Earth Vector. While there’s some overlap with GADM at the upper boundary levels, Natural Earth Vector may not include some of the finer administrative boundaries available in the GADM . But it will have a wide variety of other geographic features not available in GADM in vector format at multiple zoom levels (list from the web post):

  • Continents (North America, Europe, Asia, etc)
  • Cultural regions (South Asia, West Africa, etc)
  • Countries (US, Canada, Mexico, etc)
  • Country sub-divisions (for the US, states, semi-independent territories, dependencies, associations)
  • Disputed territories (like Kashmir, Northern Cyprus)
  • 1st order admins (states, provs)
  • Bathymetry
  • Lakes
  • Lake Center Lines
  • Rivers (including attributes that allow easy “tapering” of drains)
  • Islands
  • Glaciers
  • Populated places (urban boundaries, not city points)
  • Cities (point locations)
  • Physical features like peaks, ranges, valleys, plains

I’ll try to post again when it’s officially released.

Via Kelso’s Corner.


Portable GIS 2.0 Released

A little more than a year ago, I posted about the release of Portable GIS 1.0, aka “GIS on a stick”, a suite of portable GIS programs that could be installed on a thumb drive and run from any computer. Jo Cook of Oxford Archaeology has just released version 2.0, which offers more features, including updated versions of software available on version 1.0:

  • gvSIG (1.1.2)
  • Quantum GIS (1.02)
  • Grass (accessed through Quantum GIS)
  • PostgreSQL (8.4.01)
  • PostGIS (1.4.0)
  • Xampplite: PHP, MySQL, Apache (1.6.2)
  • Geoserver (1.7.6)
  • FWTools: ogr, gdal, python, mapserver, openEV (2.4.2)

Plus a bunch of new apps for 2.0:

  • Tilecache (2.10)
  • Featureserver (1.12)
  • PgAdmin III (1.10)
  • OpenLayers (2.8)
  • uDig (1.1.1)
  • SqlSync (cross-platform database synchronization)
  • Shp2Text (converts shapefiles into csv, with coordinate columns)
  • Ogr2Gui (GUI for OGR toolkit)
  • ShapeChecker (Checks and fixes corrupt shape files)
  • GeoMetadataExtractor (extracts metadata from georeferenced images)
  • libgeoGUI (extracts and embeds worldfiles and metadata to/from GeoTiffs)

Was surprised to see the last two, as they’re a couple of my own modest utilities:

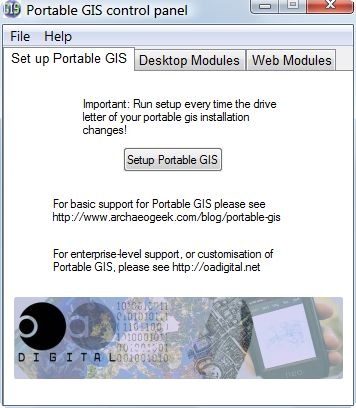
Program comes with a self-contained installer that lets you select the drive you want to install the package on. This would normally be a thumb drive, but you could also install it on your own root drive or an external hard drive if you like for a quick and easy set of hard-drive-based GIS apps. If installed on a hard drive, I’d recommend deleting the autorun.inf file, as that will change the drive icon to that of the PortableGIS control panel app. You’ll find the latter in the root directory of the drive you installed it on:

PortableGISCP

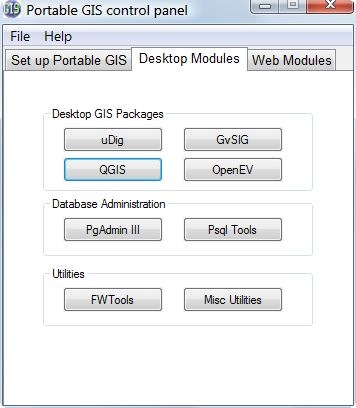
I found configuring the original system variables a bit of a pain with version 1.0, and simply couldn’t get some apps to work correctly; version 2.0 makes it a lot easier by just clicking the Setup Portable GIS button above and following the directions in the command window that pops up. You have to do this every time you run Portable GIS with a different drive letter, which means only once if you install it on a hard drive. The other tabs let you select the desktop apps to run:

PGModules

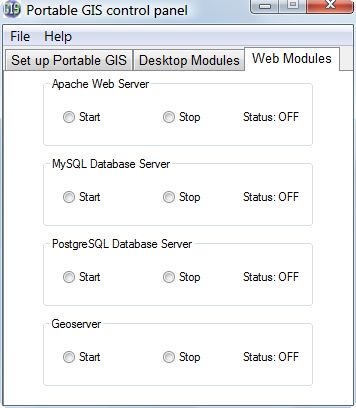
And start and stop server apps required by some of the desktop apps:

PGWeb

As installed, the Portable GIS suite takes up about 1.2 GB of space, which means it won’t fit on a 1 GB thumb drive by itself as version 1.0 would with a bit of extra effort; but two GB thumb drives are pretty cheap these days.

A final tip: as installed, the Portable GIS menu will come up automatically whenever you plug the thumb drive into a computer that has AutoPlay enabled. If you don’t want this (like me), just delete the autorun.inf file on the thumb drive.

Portable GIS 2.0 is free, and freely distributable; however, if you want a custom enterprise-ready version of this suite, OA Digital offers this as a paid service.