The stand-alone GPS Map Viewer plots points and paths from a KML or KMZ file in a Google Maps view. While you can do this with any number of online apps, including the My Maps feature in Google Maps itself, the GPS Map Viewer offers a couple extra functions not available in some of those.
Get a list of all the individual points in a KML path in the info pane at left. Clicking on any of them, or on a individual waypoint, will bring up their position info in the bottom left pane, where you can copy and paste it somewhere else.
Move the cursor over any point plotted at right, and its name will show as a pop-up
Double-click on any path point to highlight it in red, and re-center the map on it; same effect by dragging and dropping a point from the list onto the map.
Clicking on the small vertical red line brings up a toolbar
Functions from left to right are to save the view as a JPG, Print Setup, Print Preview, and print the map view with plotted data directly. You can drag and drop this toolbar anywhere it’s convenient.
I’ve never really gotten interested in “geocaching”, the recreational sport of tracking down of hidden containers or cache by geographic location. But I’ve just found out about a related variant that meshes nicely with my interest in geology: EarthCache. As with a geocache, you go to a location based on geographical coordinates, but the reward is not tracking down a box or trinket, but seeing an area with interesting or unique geological features. Earthcaches are located around the world, with roughly half of them are in the United States. There’s a searchable index that lets you locate Earthcaches by country, state, and type (fossil site, erosional feature, igneous feature, etc.). Quick tip: for sites in America, choose “USA” for the country rather than “United States”’; the latter only has a few sites listed. Once you locate a site of interest, clicking on the link will take you to the information page for the site at Geocaching.com:
The information page generally includes a description of what makes the site interesting geologically, often with diagrams, photos and references. For full site coordinate data, you’ll need to register at the site and agree to a standard disclaimer, i.e. they’re not responsible for anything bad that might happen. Once registered, the coordinates will show up at the top, along with the option to download a LOC waypoint file. GPX file downloads require a paid membership, but LOC files can be opened using the free program EasyGPS and then either directly uploaded to your GPS or saved as a GPX file.
If you want to keep track of the sites you’ve visited, and get official recording of your visit at the Geocaching site, the info page will list off some required information, like photos, a general description, and several questions to answer about the geology. You can also leave comments about your visit, or read those of others before you go. And if you have a site that you think would make a good EarthCache, you can submit it. This is a great resource for both geology nuts and educators.
Stumbled across this the other day, and while I don’t currently have the need for it (or a copy of ArcGIS to try it out on), it sounds useful enough to post about. NOAA’s Center for Coastal Monitoring and Assessmentoffers a free extension for ArcGIS called the Habitat Digitizer:
The Habitat Digitizer Extension is designed to use a hierarchical classification scheme to delineate habitats by visually interpreting georeferenced images such as aerial photographs, satellite images, and side scan sonar. The extension allows users to create custom classification schemes and rapidly delineate and attribute polygons, lines, and points using simple menus. The extension allows new hierarchical classification schemes to be easily created, modified, and saved for use on future mapping projects. There are several advantages to using classification schemes with a hierarchical structure including: the detail of habitat categories can be expanded or collapsed to suit user needs, the thematic accuracy of each category/hierarchical level can be determined, and additional categories can be easily added or deleted at any level of the scheme to suit user needs.
While written for habitat digitization, it could prove useful for any digitization projects with extensive classification requirements. Versions are available for ArcView 3.0, ArcGIS 9.0, and ArcGIS 9.2 from the product page; download files include a PDF manual.
I posted version 1.0 of my utility TritonRMP Helper on this site a few weeks ago, an aid to creating custom raster maps for the Magellan Triton GPS series. It re-projects a GeoTiff to geographic/WGS84 coordinates (if necessary), then extracts out the calibration data needed by the program TritonRMP Maker to convert the TIFF file into a Triton-compatible RMP file. I’ve added a few enhancements to it, and voila, version 2.0. Check the original post for basic info, but here are the improvements:
The biggest change is in exporting calibration data to TritonRMP Maker. In 1.0, you had to manually copy the coordinates of calibration points into the program. Version 2.0 of TritonRMP Helper now creates a “gmap” file containing all the calibration data needed by TritonRMP Maker; no more manual copy-and-paste required, which cuts the time and work required a lot. Load the gmap file into the Maker program with the File => Map => Import Maps command. You can load multiple gmap files at the same time to combine maps, or different zoom levels, in the final RMP output. The name of the gmap file is displayed at the top of the program, along with the GeoTiff file associated with the calibration data:
Version 1.0 allows rescaling of GeoTiff images down to smaller sizes, for use at lower zoom levels, but this sometimes fails without warning for very large images. Version 2.0 checks for this failure, and gives you an error message. You can sometimes get the rescaling to work by exiting the program, then starting it up and trying again.
Version 1.0 came with no install program, just a zipped folder containing the executable and associated files. Some people were reporting issues with the “comdlg32.ocx” ActiveX control being missing on their system, and some would probably prefer to have a regular program install. So the program is now available in two versions: an executable for a full install, and a zipped folder version for those who don’t want the full install.
Standard disclaimer, i.e. use it at your own risk, and double-check any maps you produce for accuracy. And report any bugs you find to me via my Contact link.
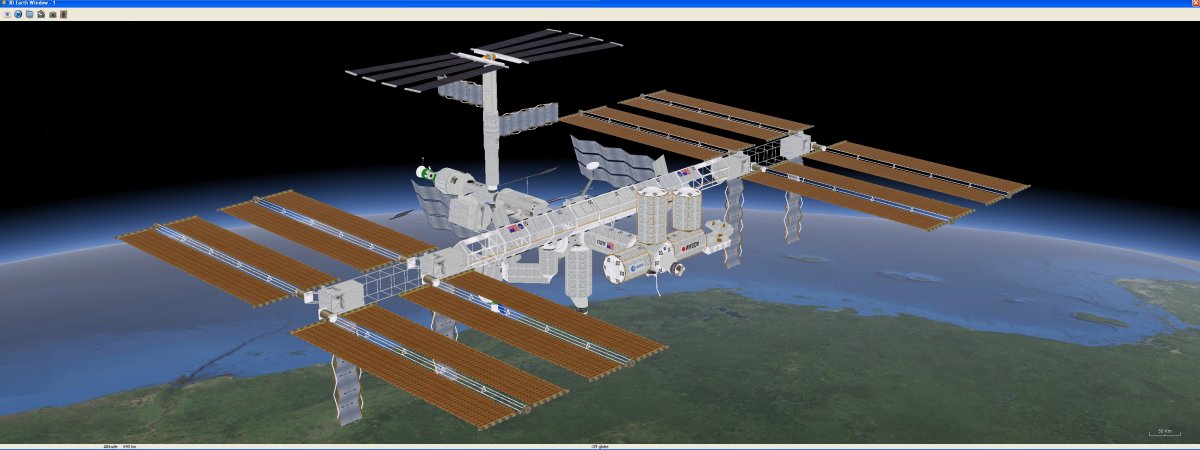
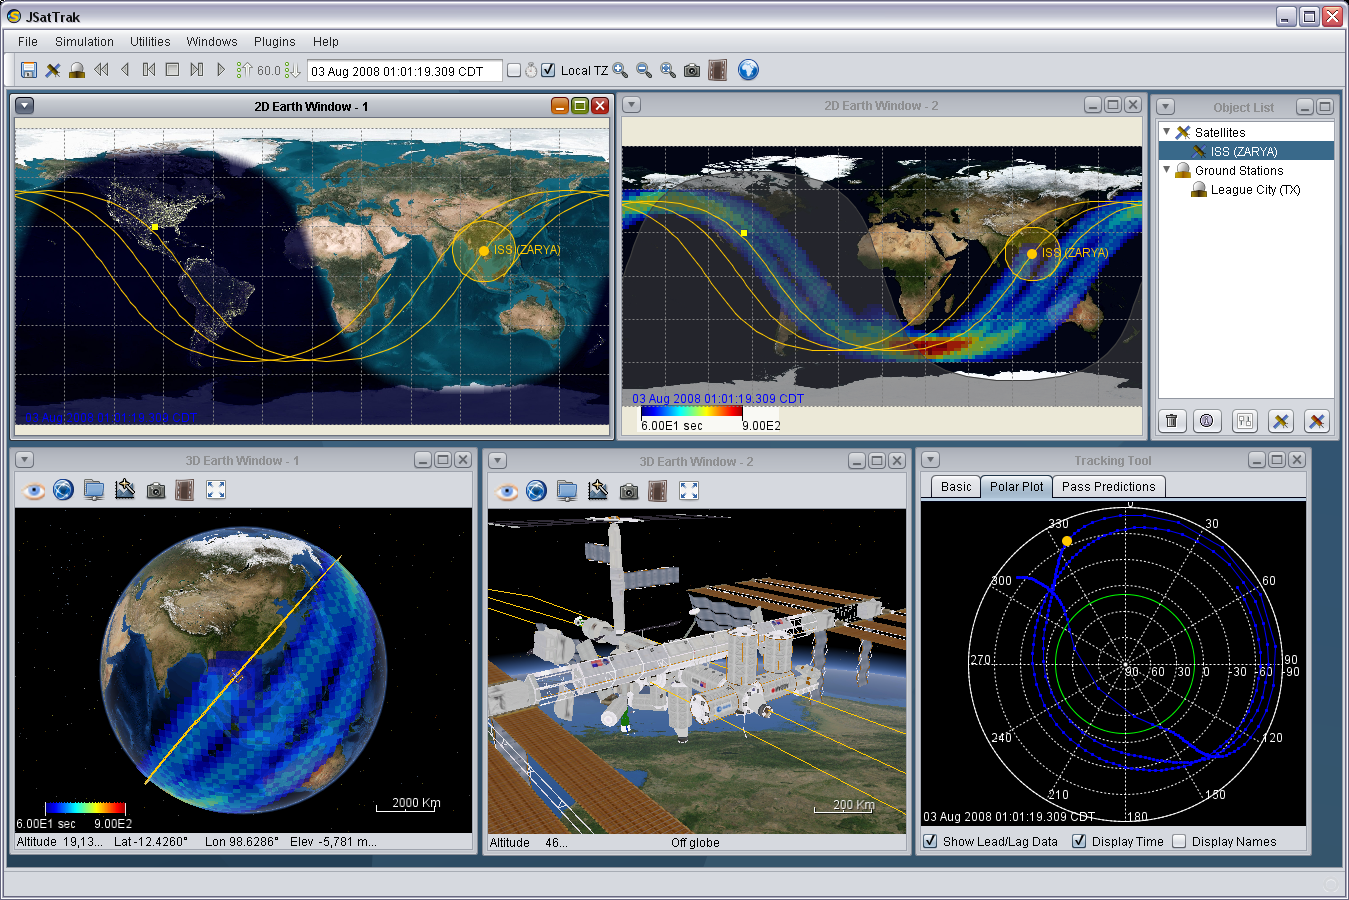
3D model loader and new model centered view mode (ISS example) (v3.5)
Full screen exclusive mode for 3D windows (v3.5)
Nimbus look and feel support (screenshot) for java 1.6 update 10 or greater (v3.5)
More 2D map images and ability to load customized maps (v3.5)
Added 2D Earth lights night image effect (v3.5)
Run script without displaying GUI (v3.6)
TLE data importing and user defined datasets (see the readme in data/tle_user) (v3.7)
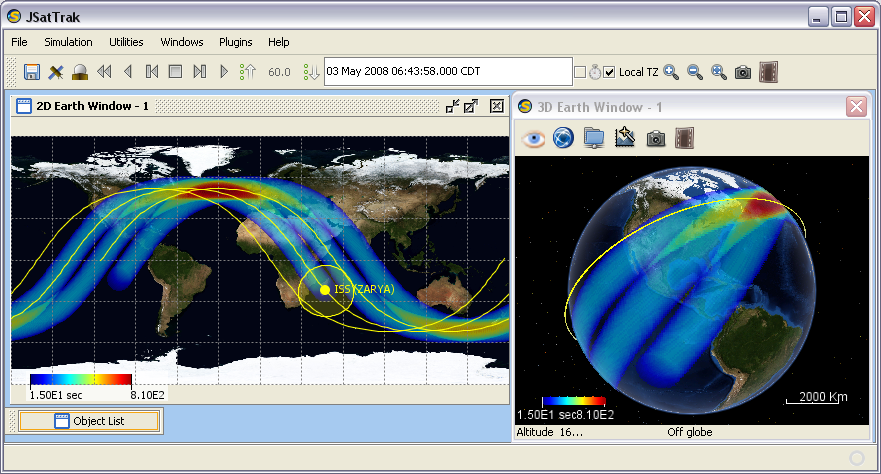
Here are two orbital tracks and coverages for US GPS (random satellite in green), Glonass (random satellite in red:
And the same plot for the two prototype European Galileo GPS satellites:
Data is available for all US GPS, Glonass, Galileo and SBAS (WAAS/EGNOS) satellites, as well as the US Navy and Russian LEO systems; find them in the Satellite browser. Be sure to check out the screenshot gallery as well to get a feeling for what the program is capable of, but don’t bother download the .jst scenarios; they were created with an older version, and the new version doesn’t support this format.
ColorBrewer is an online Flash app designed to help select appropriate data coloring schemes for maps, including sequential (choropleths), diverging (data with break points), and qualitative (discrete categorical data). I’ve covered version 1.0 before, and now ColorBrewer 2.0 is out. Not a huge number of functional differences, but some useful additions (and one disappointing subtraction):
More parameters are selected by drop-down boxes instead of buttons; bit faster this way
All controls are on the left side, making them easier to find
You can now choose between a colored background and a terrain background
Color transparency can now be set between 0 and 100%
More choices for background, road, city and border colors
You can now screen color schemes by appropriateness for color blindness, photocopying and print. In version 1.0, you only had icons showing which uses were appropriate, and these are still available in the “Score Card” tab at lower right
More options for color scheme export directly from the program, including an Excel file of all available color schemes, export in Adobe Swatch Exchange format (ASE), and in-program text hex color codes for copying and pasting into graphics programs.
No more map zoom; I miss this option.
Here’s a screenshot of 2.0:
The National Cancer Institute has taken the ColorBrewer color ramps and incorporated them into ColorTool, a free plugin for ArcMap. From the website:
The program runs from a button in the toolbar and opens a form that guides the user in choosing a classification scheme…. ColorTool supports Quantile, Equal Interval, Natural Breaks (Jenks), and Unique Value classification types…. There are also legend options, area borders, and exclusion statements in the tool. ColorTool simplifies the display process by offering preset color schemes and eliminating incompatible options.
For a while, there were two programs you could use to calibrate and convert raster map images into Magellan-Triton-GPS-compatible maps, TritonRMP Maker and RMP Creator (website in German). The author of RMP Creator apparently decided to remove the custom map calibration and conversion functions in favor of those in TritonRMP Maker, but did keep the program active for one very cool function: converting rasterized Open Source Mapping (OSM) data into Triton-compatible map formats.
Based on the map zoom level, the program will automatically choose which output zoom levels will be available, and you can select/deselect them by checking the boxes at the bottom. You have the choice of basic OSM street maps as above, or the OSM Cycle Map which includes topographic contours:
Specify the output filename in the ResultFiles box, click on the “Execute Conversion” button, then wait a while as the program downloads map tiles for multiple zoom levels, combines them, and converts them to a single RMP file for use in the Triton GPS unit. Once completed, you can install the map file into your Triton with Vantage Point, or copy it directly to the Map_data folder on the SD card used with the Triton. They’re not vector-map sharp, but do show streets and street names clearly enough:
Yesterday, I posted about TritonRMP Maker, a simple program that lets you take any raster map image and convert it into a format compatible with the Magellan Triton series of GPS receivers. Two drawbacks of the program are the requirement that the map be in geographic projection, WGS84, for best results, and its inability to use the embedded georeferencing data in GeoTiffs to automatically calibrate an image. I’ve cobbled together bits and pieces from several other programs I’ve written to create TritonRMP_Helper. This program will:
Contents of the Free Geography Tools Blog copyright 2007-2018; all rights reserved.
Determining the accuracy, reliability, validity, or appropriateness of any of the software or data written about in this blog for any uses is the sole responsibility of the reader, not the authors of the blog posts. The blog authors have no liability for any uses of the software or data described here.
Shopping at Amazon through the link below helps support the site. Thanks!


