blankblank blank


Author Archive for Leszek Pawlowicz Page 5 of 79


Create Custom Raster Maps For The Magellan Triton GPS Units With TritonRMP Maker

The Magellan Triton 2000 GPS receiver I’ve reviewed in previous posts (one, two), and other similar units in the Triton series (the 400, 500 and 1500), are notable for their ability to display raster imagery like topographic maps and aerial photos. When first released, this was only available through the National Geographic Topo! software, which was expensive, buggy, and not very easy to use. While the National Geographic Topo! software has supposedly been improved, you’re still limited to their maps for upload to the Triton units, and they’re still expensive. And until recenlty, there was no ability to add maps of your own imagery to these GPS units. If National Geographic Topo maps were the only option for putting raster maps on the Triton GPS units, there wouldn’t be a compelling reason to buy them.

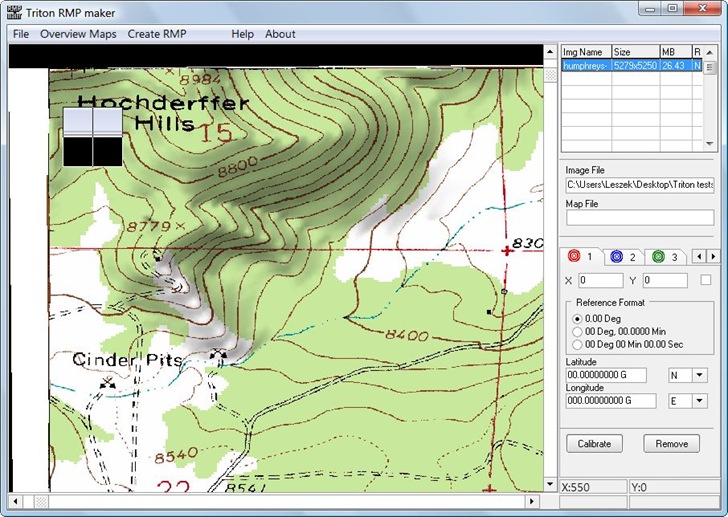
Fortunately, Mikhail Sharonov managed to reverse-engineer the format for these raster maps, and has released a free utility called TritonRMP maker that lets you create your own custom raster map files for use in Triton series GPS units. It’s a stand-alone program with no install required, just unzip it to the folder of your choice and run it:
TritonRMP

If you own the popular GPS program OziExplorer, and have used it to calibrate map images, you can import those maps and calibration data directly into TritonRMP. If not, you can open map images in one of 18 different formats, either downloaded directly or created in the GIS program of your choice, then use the built-in calibration facility to georeference the image by:

  1. Clicking on one of the colored calibration tab icons in the window at right
  2. Double-clicking on a known location in the map window to place the icon there
  3. Entering the geographic position for that location in the lower right
  4. Repeating the process for at least one more point, with the option for three more points
  5. Clicking the “Calibrate” button to calibrate the image

TritonRMP Maker automatically sets the zoom levels at which the map becomes visible/invisible based on the geographic size of the pixel. You can add additional images to the mapset that will show up at different zoom levels; for example, you could add and separately calibrate 1:250K, 1:100K and 1:24K topographic maps, and have the appropriate scale map show up at an appropriate zoom level on your GPS unit. When all maps are added and calibrated, use the Create RMP function to generate a raster map file for the Triton in the RMP file format; the name you save it under is the name it will have in the Triton. When the map generation process is complete, you could add the map to Magellan’s Vantage Point software and use that to upload it to your Triton GPS using the USB 1.1. interface (12 Mbps). But it will be easier and faster to stick your Triton’s SD card into a high-speed USB 2.0 reader (480 Mbps), and copy the RMP map file directly into the Map_Data directory on the SD card; when you replace the SD card back in the Triton, this new map will show up in the map selection screen where you can select it for viewing.

TritonRMP Maker is neat, fast and simple to use, but does have several drawbacks:

  • For the best calibration results, the map should be in geographic projection (latitude/longitude); many maps are likely to be in some variant of the Mercator projection, like UTM.
  • Many map files, like GeoTiffs, come with georeferencing infomation already embedded in them, and it seems like a waste of time to have to re-calibrate them in TritonRMP Maker.

For GeoTiffs, I’ve written a small utility program that will help with both of these issues; that’s tomorrow’s post.
A Review Of The Magellan Triton 2000 GPS Receiver – Part II: Out In The Field

Yesterday’s post reviewed some of the hardware and software characteristics of the Magellan Triton 2000 GPS receiver, comparing it to my old Garmin 60Cx.  But the real test of any GPS receiver comes out in the field – how good a job does it do at determining your position, and recording data? I took both units out on field work in the southern Arizona desert in August (yes, I’m crazy), and also for a hike in my neighborhood, to compare the two.

Continue reading ‘A Review Of The Magellan Triton 2000 GPS Receiver – Part II: Out In The Field’


A Review Of The Magellan Triton 2000 GPS Receiver – Part I: Hardware And Software

Not too long ago, Magellan announced that they had upgraded the firmware and PC software for their Triton line of handheld GPS receivers, noted for their ability to display raster imagery, and offered to send out review units to interested people. There are several free utilities for the Triton series that I’d been interested in posting on, plus I’d always been interested in the raster map capabilities of these units. I requested a review unit, and they were good enough to send a Triton 2000 to me a few weeks ago. I’ve had the opportunity to evaluate it in both recreational and field work environments, comparing it with my current GPS receiver of choice (Garmin 60Cx), and thought I’d post a review of the GPS unit itself before posting about free utilities.

Continue reading ‘A Review Of The Magellan Triton 2000 GPS Receiver – Part I: Hardware And Software’


Free Outline Maps

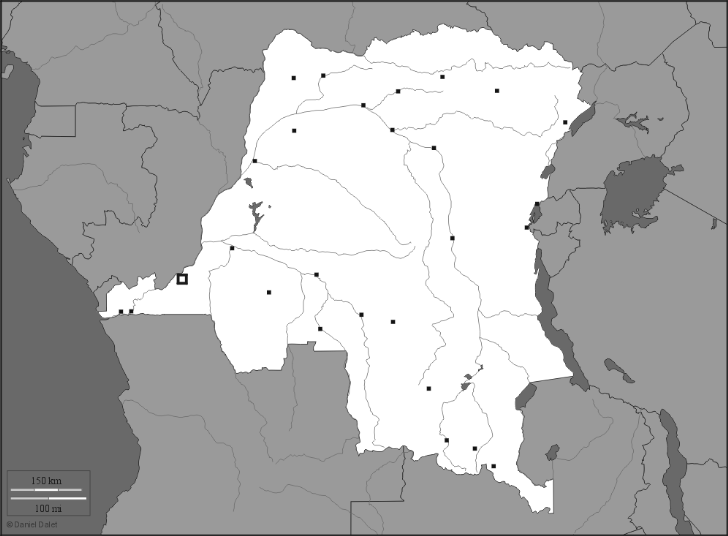
d-maps.com offers over 4000 outline maps of countries/regions of the world, each available in 6 different formats:

  • GIF (Note: to acquire the image in this format, right-click  on the map image and save it)
  • PDF
  • CDR (Corel Vector Graphic Drawing)
  • AI (Adobe Illustrator)
  • SVG (Scalable Vector Graphics)
  • WMF (Windows Meta Format)

Some maps are partially colored in, others just black and white. Maps can include just country borders, or more information like cities, provinces, hydrographic data, and more:

rdc13

A small handful of historic maps as well, in an eclectic set of topics. The total number of maps is growing, so check back on a regular basis.

Via Catholicgauze.


Map Folding

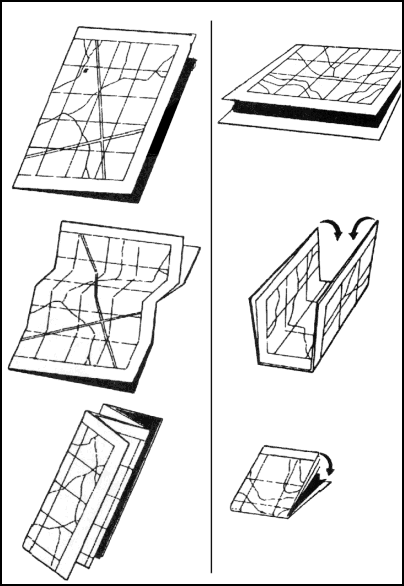
If you still do old-school navigation with map and compass, the US Army’s Field Manual on Map Reading And Navigation is an excellent resource. You can buy a copy if you like, but there’s an HTML version here, Google Books has it available in poor quality scanned form here, and you can view/download a PDF copy from Scribd here (book is in the public domain).  In one of the appendices, it has diagrams showing three different ways to fold a map so that you can view parts of it without completely unfolding it. The first two are self-explanatory:

fold1

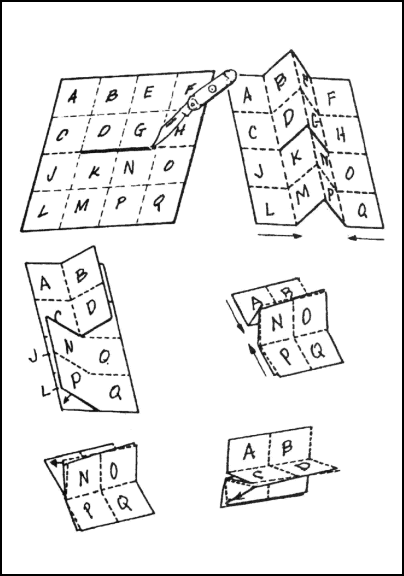
The third one, the “Protection Method”, is a nifty way to fold a map so that it takes up 1/4 of its original size so that you can paste it into a notebook, but still have all sections of it accessible for viewing:

fold2

Had to try it out to figure out what was going on. After you’ve completed the full set of folds, adhere the undersides of sections A, F, L and Q to your notebook page. You can then view the various quadrants (A-D, E-H, J-M and N-Q) by flipping the sheets over the horizontal and vertical folds that cross the quadrants. Try it with a scrap piece of paper first :).

If you have a square map and want to try something different, you might try the Turkish Map Fold; I couldn’t quite figure it out myself.


GUI For Generic Mapping Tools (GMT) Plus Added Geophysics Tools

The Generic Mapping Tools (GMT) is a collection of 60-odd command line tools for manipulating gridded and vector data, and creating high-quality output in EPS (Encapsulated PostScript) format. Working with it in command-line format isn’t the most user-friendly experience. Mirone offers a far-more accessible GUI interface to GMT’s features, and adds a few geophysics-related capabilities of its own:

  • Multibeam mission planning
  • Elastic deformation studies
  • Tsunami propagation modeling
  • Earth magnetic field computations and magnetic Parker inversions
  • Euler rotations and poles computations
  • Plate tectonic reconstructions
  • Seismicity and focal mechanism plotting

If you have MatLab installed on your system, there are source code versions available for Windows, Mac and Linux. If not, there’s a stand-alone executable for Windows systems that runs slower than the MatLab version.

Other graphical front-ends for parts of GMT include iGMT (requires Tcl/Tck), Win4GMT, and SeaTree.


Online Articles From “The Map Collector”

Published between 1977 and 1996, “The Map Collector” published articles on the history and lore of maps and mapmakers. Kunstpedia, the “knowledge base on fine- and applied arts, popularly stated arts and antiques”, has gotten permission to put articles from Map Collector online, with more articles going up on a regular basis in either HTML or PDF format. There’s a wide range of articles, like:

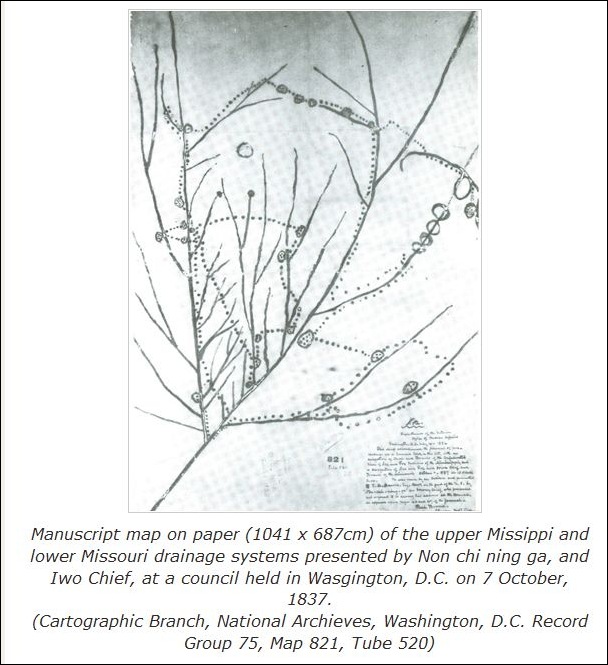
The Indigenous Maps And Mapping Of Native Americans

nativemap

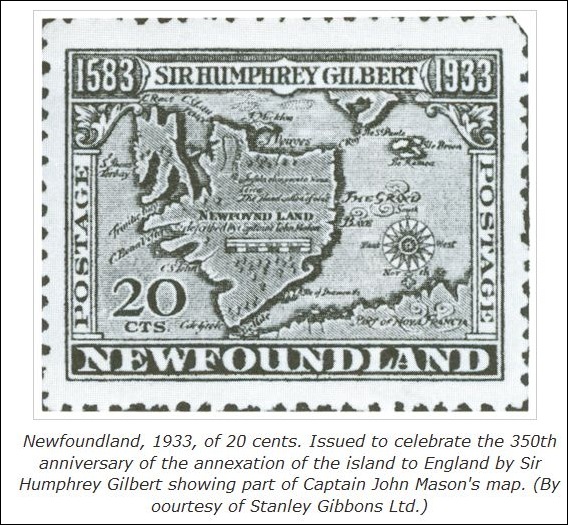
Collecting Maps On Stamps

stamps

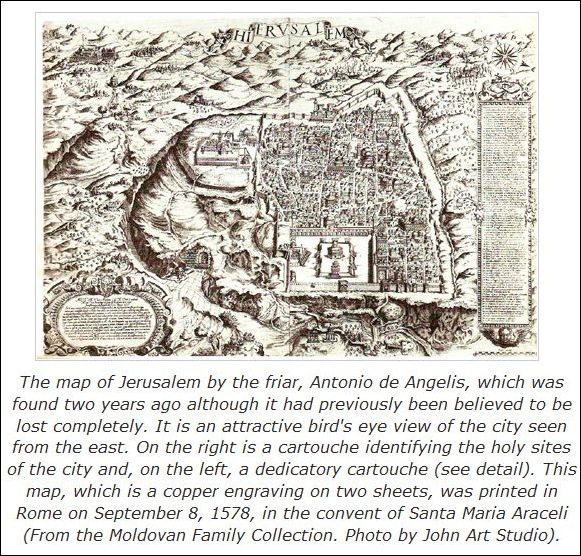
The Lost De Angelis Map Of Jerusalem, 1578

jerusalem

To browse all the articles, find the navigation bar on the home page:

mapcolnav

and click through all the pages.

Via Making Maps.


Convert Shapefiles Into SVG Format With Thematic Coloring

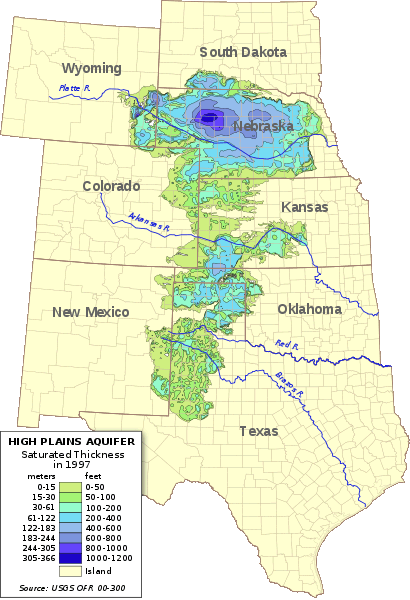
Not too long ago, I covered an online application from indiemapper that converts shapefiles into SVG format, a standard format for vector illustration programs like Adobe Illustrator or the open source Inkscape. One drawback of that site was the inability to color/shade the SVG output based on shapefile attribute data. Ken Hardy has a Perl utility called shptosvg that will take shapefiles and convert them into SVG format, and includes the ability to color files based on their attributes:

410px-Ogallala

Features (from the website):

  • Accepts source SRS specs on the command line, allowing multiple input files to have disparate coordinate systems.
  • Generates the results projected to any SRS using Geo::Proj4.
  • Works on multiple shapefiles at a single invocation, layering them in order into the SVG map.
  • Supports specification of color and other rendering options, per source file, on the command line.
  • Optionally select subset of shapes by regex on arbitrary attribute fields.
  • Support coloring of shapes by value of an attribute field.
  • Allow specification of a shapefile to use in scaling but not in rendering. That supports independent production of layers to be later combined in an SVG editor; they can all be scaled and translated according to the geometry of the base/largest layer to aid layering after the fact.

You’ll need to have Perl installed on your system; see the download page on the official Perl site for links to several different versions. And you’ll need to be comfortable working in a command-line interface; no GUI available yet. Ken has a page documenting usage, along with an example page that describes how he created the image above.

HT to Ken (of course).