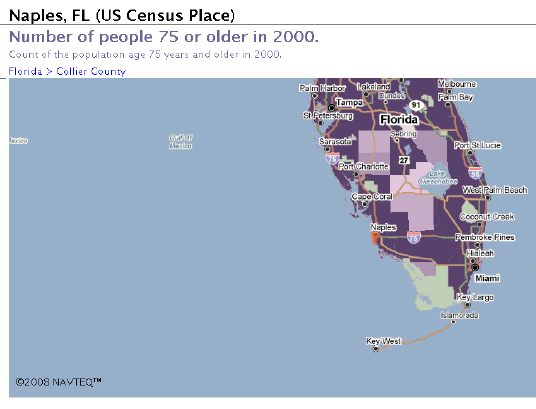
Antipodes Map is as simple a web map as you might want – double-click on a point in the top Google Maps display (or drag the map so that the marker is under the point you want), and a corresponding marker on the exact opposite location in the world (the “antipodes”, or “antipodal location”) will be placed in the bottom Google Maps display. Moving the bottom marker or display has no effect.
PolicyMap is a new site that offers access to “over 4,000 indicators related to demographics, real estate, crime, health, schools, housing affordability, employment, energy, and public investments”, and lets you display them in map, tabular and graphical formats. While some datasets require a paid subscription, many are available for free. Datasets include:
- Real Estate Analysis
- Neighborhood Conditions
- Crime
- Mortgage Originations
- Education
- Money & Income
- Demographics
- Owners & Renters
- Jobs
- Energy
- Federal Housing
- Environment
- Schools
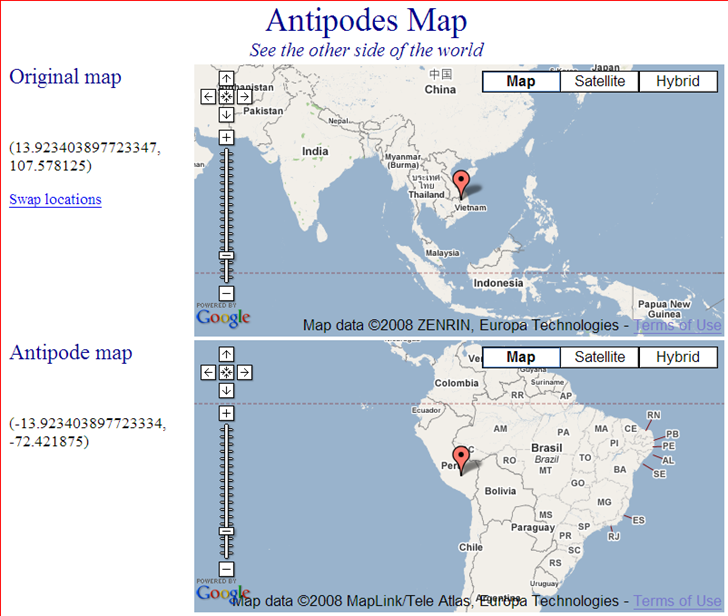
Below is a sample map showing elderly population in southern Florida:
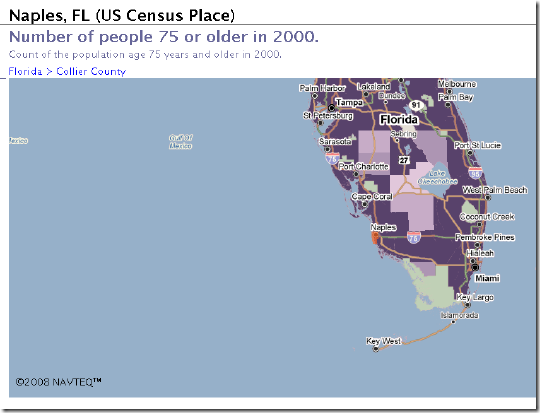
Maps can be exported in JPG or PDF format. Subscription buys access to more datasets, and the ability to upload your own data.
I covered Microsoft’s old photo geotagging tool WMMX Location Stamper a while ago in this post. Location Stamper uses Microsoft’s MapPoint maps in the display, which are already out-of-date, and I said it would be nice if they could add Virtual Earth to the app but wasn’t holding my breath. Good thing, because Microsoft has apparently abandoned that program in favor of a new one called Microsoft Pro Photo Tools. This is actually more than just a simple photo geotagging tool – it’s a full EXIF header editor, allowing individual or batch editing of metadata like description, keywords, copyright, date and time, etc. But here, I’ll talk mainly about the geotagging capabilities.
After you load in an image or set of images, they’ll be displayed in a thumbnail view at the bottom; click on the MapBrowse tab, and you’ll get a 2-D Microsoft Virtual Earth view, with the option of 3-D if you have that installed on your system (if you don’t, you’ll be given the option to install it then and there). You now have several choices for geotagging photos:
- Right-click on a photo or group of selected photos, and choose “Select GPS location for this image”. This will create a pushpin on the map that you can drag to the desired location
- If you have address/location information in the EXIF header, or if you enter it now, and click the “Get GPS Info” button, the program will look up the coordinates for that location, and tag the photo with those coordinates. Conversely, if the photo is already geotagged, you can look up a geographic location associated with those coordinates by clicking the “Get location text” button, and have that entered into the picture’s EXIF header. That includes numerical street addresses, a feature that other similar programs like GeoSetter don’t have.
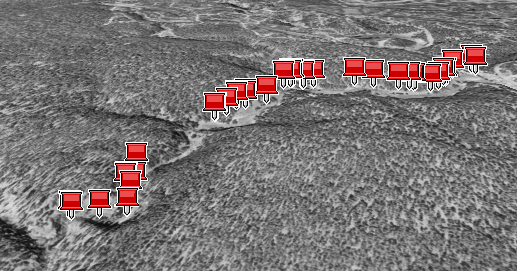
- As with other geotagging programs, you can load in a GPX file, and have the program associate coordinates with the pictures based on time. Load in a track with the “Load from file” button, select all the thumbnails you want to geotag, and click the “Place images on map” button. There’s a checkbox labeled “look up address when placing images on the map”; I tried clicking this, and got no results, but when the geotagging was done, address/location info was automatically entered for each photo’s Location metadata. You’ll have the option of selecting either “Minutes” or “Hours” for the variability in matching track time with photo time, and there’s also a slider that lets you fine-tune the time match. Other programs require you to enter an offset between local time and UTC, but Pro Photo Tools can apparently do that automatically. Once you click “Done”, coordinates will be assigned to all the photos, and pushpins plotted on the map view. Move the cursor over each pushpin to see a thumbnail for the image.
It’s important to remember that you have to tell the program to save the images with the new coordinate data and metadata (File => Save All Images with new data) If you exit with explicitly saving that data, it will be lost.
You can view the images in either the standard 2-D mode, or in VE’s 3-D mode:
You can also load in geotagged photos, display them in Virtual Earth, and edit them. Pro Photo Tools lets you create a track from these imported photos, but oddly doesn’t let you export this track in GPX or similar format; hopefully, that will be added soon. And you can’t create a KML or similar file from the photos, as many other geotagging programs can. But still, this is a solid geotagging program from Microsoft, and a big step up from Location Stamper. While it won’t replace GeoSetter in my toolbox, Pro Photo Tools EXIF editing capabilities and address lookup feature make it a useful complement.
Over a year ago, I posted on Google Map Creator, a program from the Centre for Advanced Spatial Analysis that lets you convert shapefiles into thematic colored maps for display in Google Maps. They’ve just created a new site called MapTube , “a place to put maps”, that collects links to maps created with Google Map Creator. You can search for maps covering a particular topic or area, and select multiple thematic maps for simultaneous display, to see if any relationships are visible between different datasets. Sliders set the transparency of the various maps displayed, and you can turn the legends on and off by clicking on the legend icon in the map thumbnail:
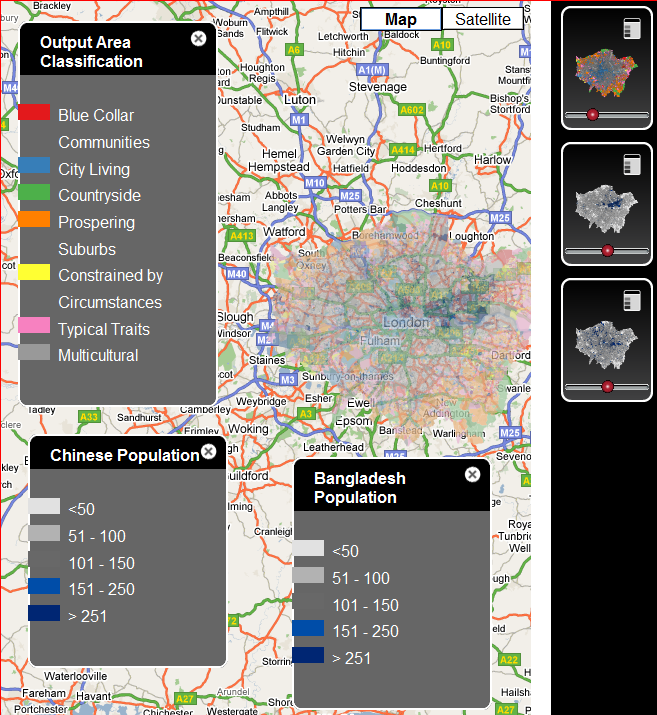
You can also create an account that lets you add your own maps to MapTube, but you have to host the actual map data yourself on your own server; MapTube’s function will be to index the metadata, preview the maps, and allow people to view them in a Google Maps interface. The current maps are heavily Anglo-centric (not surprising), and limited in number; the site’s ultimate usefulness will depend on how many people actually wind up creating maps for it. It would help if they could add an interface to MapTube directly to the Google Map Creator program, and also if there were some way in the program to directly upload Google Map Creator maps to a centralized data server and pass that link directly to MapTube.
Gazetteers are listings of the names, types, and coordinates of both natural and man-made objects. For the US, the US Geological Survey’s Geographical Names Information Service (GNIS) contains name, feature type and position information for over two million geographic features in the US. Feature classes include both man-made (populated place, bridge, canal, etc.) as well as natural features (arch, spring, arroyo, woods). There are a number of similar databases for the rest of the world, like the NGA’s GNS Server, and the GeoNames site.
Another gazetteer website worth a look is SatelliteViews.Net. For geographical subdivisions, they have the US broken down by state, and the rest of the world by country. Select a state or country, then select the type of geographical feature you’re looking for, and get an alphabetical listing of them for that particular region. Select a specific feature, and you’ll get both the coordinates and a Google Maps display with the feature location plotted.
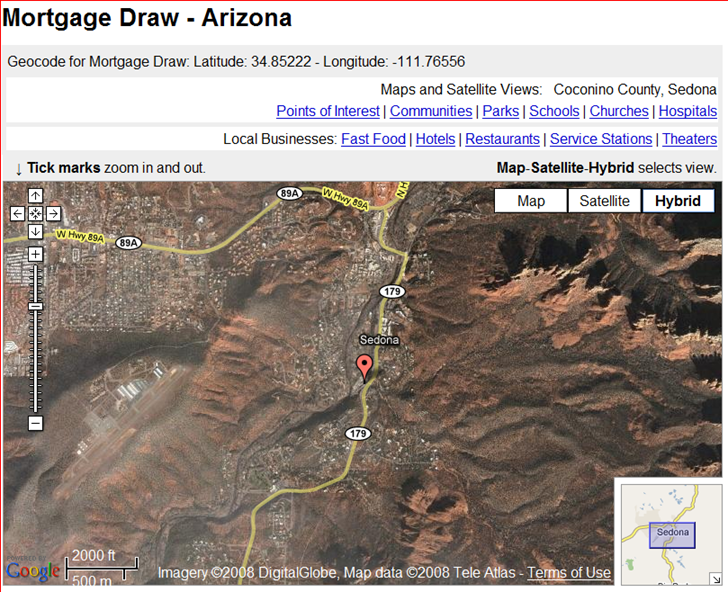
They claim to have 5.9 million worldwide geographic features indexed and linked.
Hat tip to Coy0tea (JG).
– Activity Workshop writes to say that his multi-platform GPS track management and photo geotagging application Prune has been updated (see earlier Prune posts here and here). New features include:
- New map window in the View menu, showing points overlaid on OpenStreetMap images
- New function to launch a browser showing the area in either Google Maps or OpenStreetMap
- Handling of track segments, including loading, saving and exporting, and preservation during edit and undo
- New function to merge track segments for the current selection, to make one single segment
- Display of current and average speed on details panel
- Status bar showing confirmation of actions
- Much improved French texts thanks to generous user input
Written in Java, and runs on Windows, Mac and Linux
– Need to geotag a photo, but don’t have an application like Prune, GeoSetter or GPicSync handy? You can do it online using the Sunday Morning Rides GeoTag utility. Specify the location in a Google Maps interface, set the coordinates, upload the image (JPG only), and a minute or so later you’ll see the geotagged image (or part of it) on the web page. Then right-click on the image and save it to your computer. Even though you may only see part of the image on-screen, it does tag and save the entire image, apparently losslessly. Sunday Morning Rides also has an online GPX track builder and waypoint utility.
In a comment on this post, Theron was looking for command-line solutions for converting from UTM to SPCS coordinates on a Unix system; I pointed him towards OGR and GeoTrans as possibilities, and he found that GeoTrans offered a solution. But he also discovered that finding the projection parameters for SPCS wasn’t as easy as he thought it would be. He did track down a few using Google, and was good enough to send them on to me:
A simple, unorganized text listing
Links to both a CSV-listing and an Excel spreadsheet
To find the proper SPCS zone for your location, you can use the program described in the above-linked post, or try this website.
The Mapping History site (from the University of Oregon and Universitat Munster) has dozens of static and animated maps illustrating US, European and Latin American history. Examples include “Cotton Production In The South: 1790-1860”; “Peasant Rebellions In Early Modern Europe”; and changes in the political status of South American countries. Some of the animated maps are slider-based (with a play button), and it’s obvious how they work. For other Flash-based maps, you’ll have to click on the map and select “Start” to begin the animation, and select “Key” to bring up the map legend.