There are a number of free ways to convert shapefiles to KML format for display in Google Earth, but fewer and less flexible shapefile display options for Google Maps. This site lets you upload small line and polygon shapefiles for display in Google Maps, but not in a permanent form, and with limited display options. This other site details a procedure to display polygon shapefiles in Google Maps, but it’s not particularly straightforward to implement. There’s also some direct support for displaying simple KML files in Google Maps, so you could always try converting the shapefiles to KML and then opening them in Google Maps. But there’s a Java application that makes the process reasonably straightforward for polygon shapefiles, shows the data already loaded in a Google Maps interface, and offers some added display options.
The Google Map Creator can be downloaded from the University College of London’s Centre for Advanced Spatial Analysis. The Windows version, which I’ll describe below, comes in installer format; there’s also a Java archive version that can be run in either Linux or Macintosh. Download and install the program in Windows; it will also install the Java Advanced Imaging Library.You will also need:
1. A shapefile with an associated projection definition file (.prj). If your shapefile doesn’t have a .prj file, you can create one using the free GIS editor MapWindow. Open MapWindow, select GIS Tools => Vector => Assign Projection To Shapefile, and follow the straightforward process of selecting your shapefile and its coordinate system to create a .prj file. The shapefile doesn’t have to be in latitude/longitude/WGS84, unless Google Map Creator has problems re-projecting the data into the correct coordinate system, and it will tell you that.
2. A thematic variable you can plot that is numeric in nature – Google Map Creator doesn’t handle alphabetic variables yet. For small ranges of alphabetic variable, you could open the DBF file in OpenOffice, make a copy of that column, and replace the alphabetic variables with discrete numeric values, but with larger numbers of alphabetic variables this can become very tedious.
3. If you want to post the map you create on the web, you’ll need a free Google Map API key. If you’re only going to use the map on a local computer, a key isn’t needed.
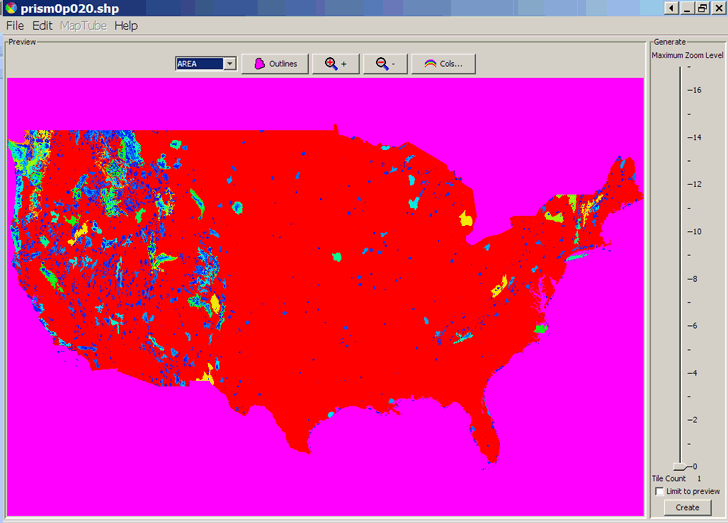
Start up the program, and use File => Open to load your shapefile (in this case, rainfall across the US; click on the picture to view a larger version of the image):
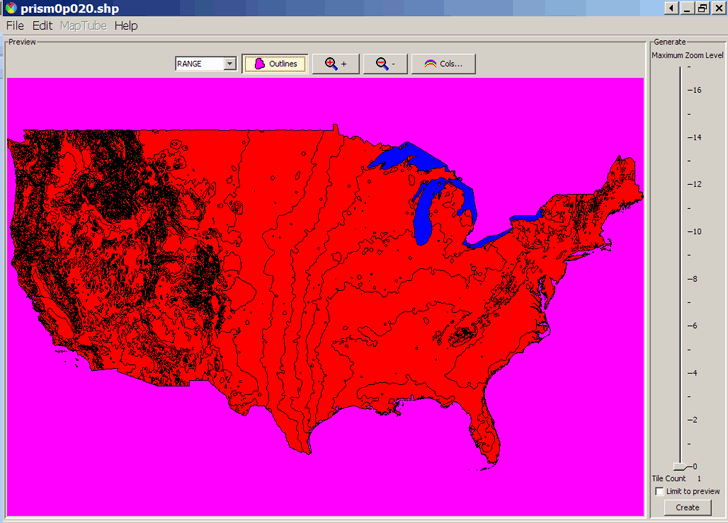
From the drop-down menu at the top, select the shapefile variable to use as the plotting theme, Range in this case. If you want to see the outlines of the shapefile polygons, click on the Outlines button at the top:
To select the colors to plot the precipitation range by, click on the “Cols” button at the top:
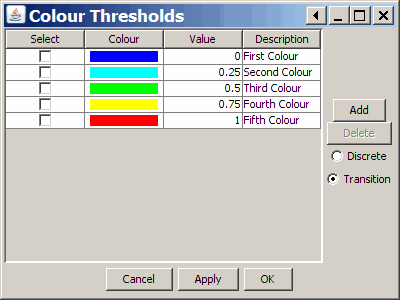
Click on Add to add another color; check the Select box and click Delete to delete a color. Double-click on a Value or Description to modify it. As you modify the values, they will automatically be sorted from low to high. Clicking once on a color bar brings up a palette that allows you to select a desired color. Selecting Discrete makes that color apply only to the specific value specified; selecting Transition makes the color for a value shade from one value to another. For example, with the following values entered, and Transition selected:
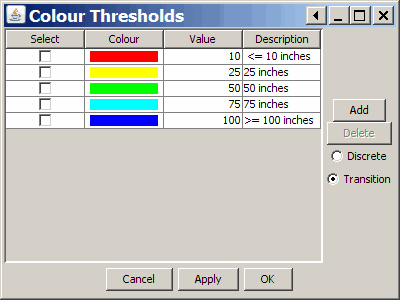
the resulting map looks like this:
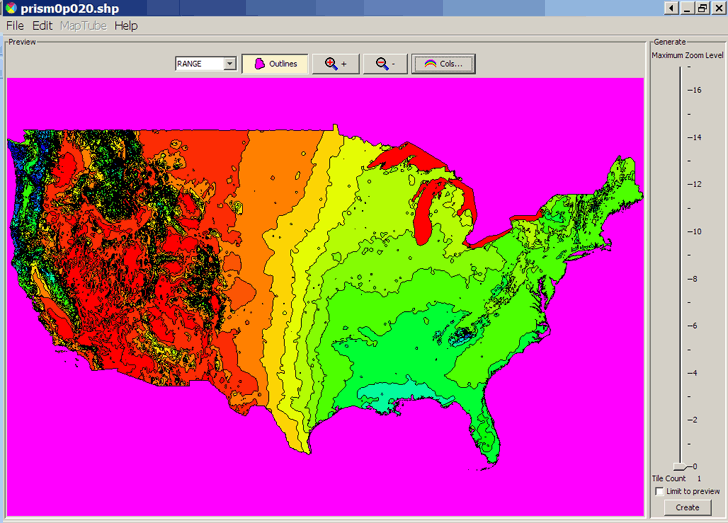
where, for example, shades of orange represent values between red (10 inches and less) and yellow (25 inches).
At the left, you set the maximum permissible zoom level in the Google Maps interface. Higher zoom levels mean larger number of image tiles to be generated, stored, and served up. For example, a maximum zoom of 4 creates 16 tiles, while a maximum zoom of 8 will generate 1422 tiles.
Finally, select Edit => Page Data. Here you enter your Google API key if you have and need one, the minimum API version required (usually 2 is fine), and the title of the map:

Click on Create in the lower right-hand corner, then Start, and the image tiles and an HTML file needed to display the Google Maps interface will be created in the same directory that holds the original shapefile. The image tiles will be stored in a directory with the filename of the shapefile with “-tiles” appended; the HTML file will have the filename of the shapefile with an .html extension. There will also be a ucl75547A.gif file in the directory, the logo of University College of London. To view the newly-created Google Map with the shapefile thematic overlay, open the HTML file in your browser:
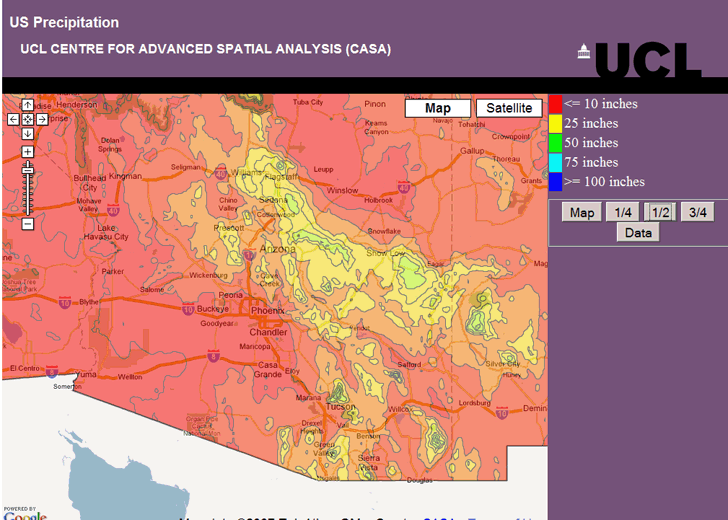
The map key at the upper-right includes the range descriptions entered above. Below the map key are buttons that let you set the transparency of the thematic overlay. “Map” sets the transparency at 100% (no overlay visible), “Data” sets the transparency at 0% (fully opaque), and the fraction buttons set transparency in between those values; the map above is shown at “1/2” transparency.
If you’ve entered a valid Google Map API key into the Page Data, you can now upload the HTML files and image tile directory to the web server of your choice for public Internet access to your map.
Could you explain this a little better?
“2. A thematic variable you can plot that is numeric in nature – Google Map Creator doesn’t handle alphabetic variables yet. For small ranges of alphabetic variable, you could open the DBF file in OpenOffice, make a copy of that column, and replace the alphabetic variables with discrete numeric values…”
I’ve been trying to use GMapCreator to convert a US Congressional District shapefile from the Census Bureau into custom tiles, but I keep running into an error that I can’t seem to figure out. At first, I was getting the .prj error message (even when it existed) but eventually seemed to have gotten past then. Then, it looks as though everything is proceeding just fine until the very end when I get this message: “No fields in the shapefile contain numeric data. The file must contain geometry and at least one numeric field which determines the value of the region.”
Any suggestions?
I’m guessing that your shapefile doesn’t have a numeric field, e.g. one describing population, growth rate, etc., and the GMapCreator requires at least one. By opening the shapefile’s DBF file and adding a field with numbers, you could get around that; for example, creating a column of numbers representing the district number.