A nice tool that lets you create an embedded Google “My Maps” map, along with a KML file, on any web page.
Via Mapperz (which has an example) via Education/Technology (with another example).
Exploring the world of free tools for GIS, GPS, Google Earth, neogeography, and more.


A nice tool that lets you create an embedded Google “My Maps” map, along with a KML file, on any web page.
Via Mapperz (which has an example) via Education/Technology (with another example).
I’ve been meaning to post about this site for a while, and it’s natural to do so after posting about GE-Path. The Geo Utilities website offers online tools that let you simplify KML files by reducing the number of points, create buffers (areas around a point, line or area of a specific size), calculate polygon areas, and determine the intersection location of two different layers.
Continue reading ‘Online Google Earth Utilities For Buffering And Area Calculations’
Frank over at Google Earth Blog was nice enough to link to my post last week about GE-Graph. In his post, he describes another great Google Earth utility from the same author that I was also planning to post on, and here it finally is.
Continue reading ‘Drawing Grids, Paths And Polygons In Google Earth Using GE-Path’
There are a number of free ways to convert shapefiles to KML format for display in Google Earth, but fewer and less flexible shapefile display options for Google Maps. This site lets you upload small line and polygon shapefiles for display in Google Maps, but not in a permanent form, and with limited display options. This other site details a procedure to display polygon shapefiles in Google Maps, but it’s not particularly straightforward to implement. There’s also some direct support for displaying simple KML files in Google Maps, so you could always try converting the shapefiles to KML and then opening them in Google Maps. But there’s a Java application that makes the process reasonably straightforward for polygon shapefiles, shows the data already loaded in a Google Maps interface, and offers some added display options.
Continue reading ‘Thematic Polygon Shapefile Display In Google Maps’
If you were wondering how I created the Google Earth rainfall plot in yesterday’s post on FAO climate data, I didn’t use one of the shapefile to KML converters I’ve posted about. Instead, I used a free program called GE-Graph that takes tabular data and lets you plot it in colors and polygons that depend on the value you’re plotting.
Continue reading ‘Plotting Data In Google Earth Using GE-Graph’
Via OgleEarth, a relatively new blog called Census KML Data Visualization has been posting visualizations of US Census data in Google Earth, with links to the KML files. Newer posts have branched out to visualizing campaign contributions by congressional district and time. Nice stuff, and a good complement to the gCensus site.
After being unofficially open for several weeks, Matt Fox’s Google Earth Library is now fully open and operational. Many useful and interesting sets of placemarks and tiled overlays, covering topo maps, aerial photos, aviation, weather, geology, solar system objects, global warming, etc., with more added every day. Add this one to your bookmarks/RSS feeds.
I’ve posted before about absolute positional accuracy issues in Google Earth. The Google Earth coordinates corresponding to a feature on the earth can be off from the true coordinates of the feature, about 30 feet in my neck of the woods. With the new Google Maps “My Maps” feature, I was curious as to whether you get any improvement in positional accuracy using Google Maps to create KML files for a point, rather than using Google Earth directly.
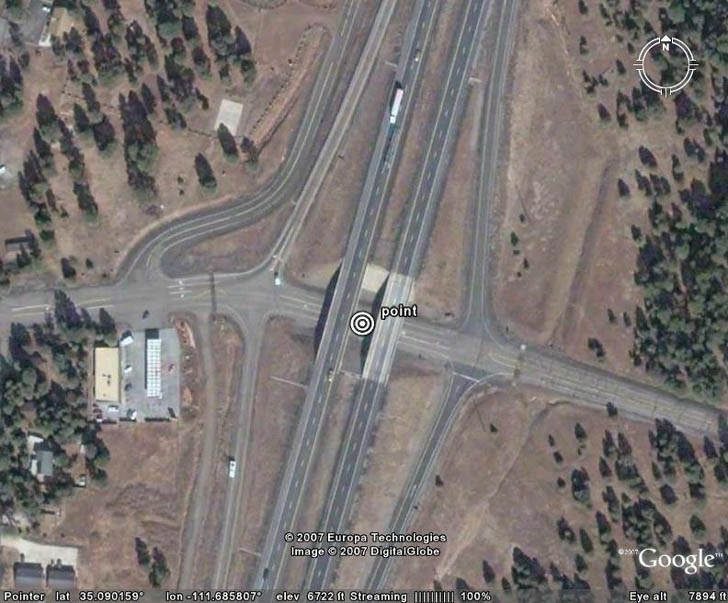
First, I created a point in Google Earth at a highway intersection:
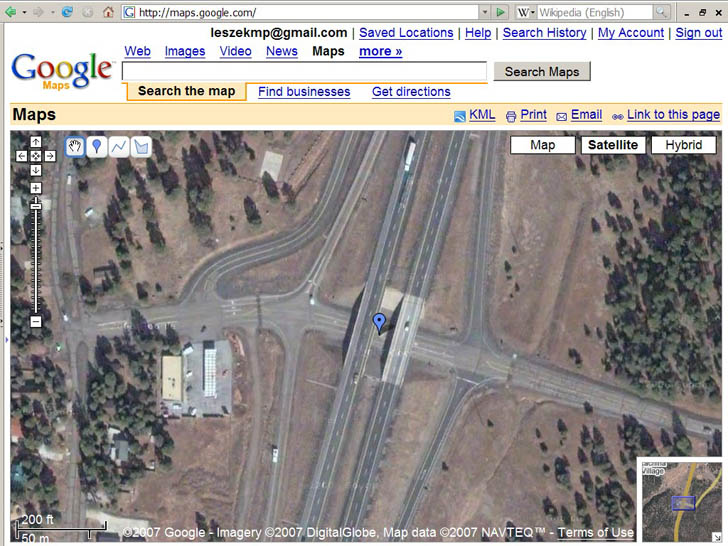
Next, I created a point at the same location in Google Maps “My Maps”:
Exporting the Google Maps point as a KML file, bringing it in to Google Earth, enlarging the view, and measuring the difference between the two:
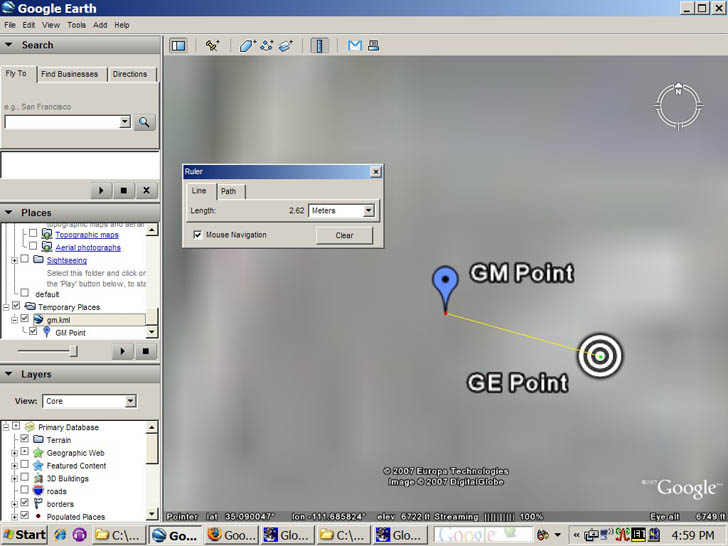
GM point is from Google Maps, GE Point from Google Earth. There’s a slight differential in the two, about 2.5 meters, but that’s almost certainly due to my inability to position the points exactly in the right location in both images, i.e. I’m a klutz. So coordinates match up reasonably well between Google Earth and Google Maps.
But if I plot these points on top of a georeferenced USGS aerial photo:
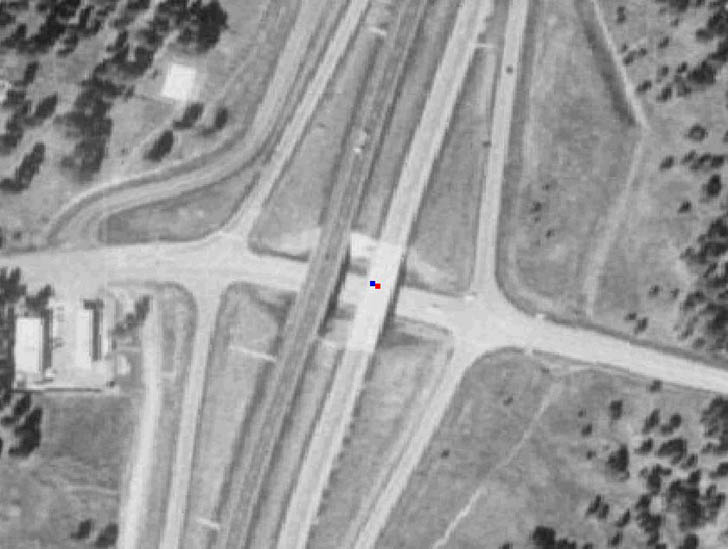
with blue being the Google Maps point, and red the Google Earth point, you can see they’re displaced from the actual position by about 10 meters, or a bit more than 30 feet. That’s comparable in size and direction to what I saw in my previous post on Google Earth accuracy. So you’ll get consistency if you export data from Google Maps “My Maps” to Google Earth, but the coordinates you get in the Google Maps KML file can still be off from the true values. It wouldn’t surprise me if the magnitude and the direction of the shift varied from place to place; if you’re hoping to use either Google Maps or Google Earth for determining positions with high accuracy, you should definitely do a ground check first to see what degree of coordinate shift there may be in your area.
Note: If you have info about the Google Earth or Google Maps coordinate shift for your area, please post it in the comments section below (location and size of shift).