A while back, I posted about Image Cutter, a program that lets you tile and view any image, e.g. a scanned map, in the Google Maps interface. Microsoft Research’s HD View offers a similar capacity, letting you post multi-giga-pixel images on the web in a flexibly scrollable and zoomable format. The website says that their goals were:
- to allow smooth panning and zooming on large images,
- only download enough data to create the current view (and possibly look ahead to the next), and
- always display the current field of view with an appropriate projection. This means that when zoomed way in you should be presented with a standard perspective projection providing a sense of immersion, and when zoomed out you experience a curved projection so that get a full overview of the scene. In between the projection should smoothly transition.
- to create your own HD View content and present it to the world via the web.
Unlike Image Cutter, HD View supports cylindrical and spherical panoramas. Unlike Image Cutter, unfortunately, HDView requires an ActiveX download, which means it’s Windows only, and currently only works in Internet Explorer. Also, the HD View content creator (hdmake) is only command-line-interface at this time.
Via AnyGeo.
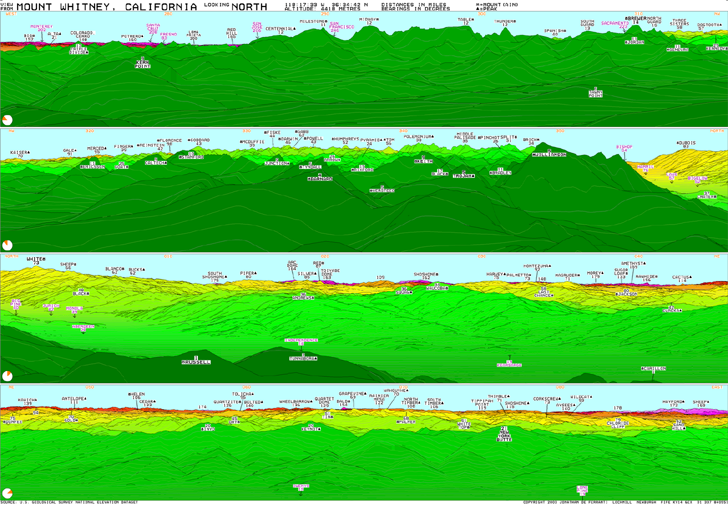
The Viewfinder Panoramas website has an eclectic mix of mountain-related data available. Computer-generated panoramas from the peak of about 200 mountains across the world show the terrain visible from the tops of those peaks, with individual terrain features labeled. Here’s an example, looking north from the top of Mt. Whitney in California (click on the image for a larger view):
The site also has links to DEM terrain data for a number of mountainous regions. Some of it is custom high-resolution data extracted from topo maps, while other datasets are SRTM-90 data with the holes patched using data from topo maps. Areas covered include the Himalayas, Andes and Alps, but scattered data from other areas (e.g. the Canary Islands, Japan) is also available. SRTM-90 data with the holes patched is available from the USGS Seamless Server, but the patching process used there can result in anomalies in the DEMs. The DEMs from the Viewfinder Panorama site appear to be of significantly higher quality than the SRTM-90 data in many cases.
Google Earth supports GIF files as image overlays, with or without transparency, but it doesn’t directly support animated GIFs. However, by “disassembling” the animated GIF into the individual frames, and then assigning each of those frames a time stamp in a KML file, you can re-create the animation effect using Google Earth’s time animation feature.
Continue reading ‘Animated GIFs In Google Earth’
The Geonames website offers a number of useful geocoding services:
- Enter a name, and get back:
- A list of the first fifty geographic features in their database that include that name
- The feature coordinates
- A link to let you plot the location of that feature in Google Maps, along with fifty other nearby features
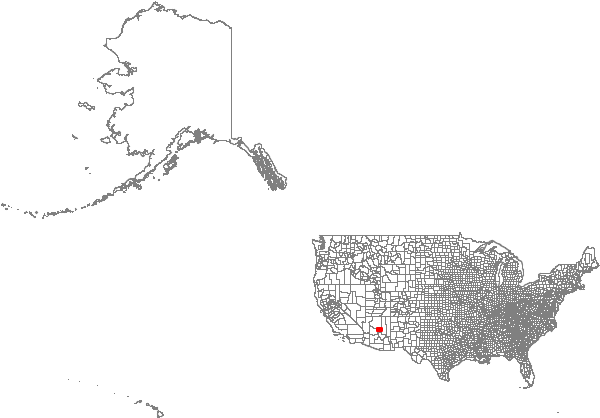
- Links to download those features in “csv” spreadsheet format (looks more like tab-delimited to me), or a png image that shows the selected feature plotted as a red point on country line graphic:
- A web-based geocoding service
- A postal-code lookup service
- A downloadable copy of the geocoding database, by individual country, or combined into a single 150 MB file for all countries
The State Plane Coordinate System (SPCS) is a projected coordinate system that achieves greater accuracy than UTM by dividing states up into sub-zones based on county, and then uses a local projection in that sub-zone (typically Transverse Mercator for zones that are oriented more north-south, and Lambert Conformal Conic for those that run more east-west). Keeping track of which county goes with which zone for every state can be a pain. The State Plane Zone Locator is a free utility that makes looking up the state plane system for any county easy. Oddly enough, the program installation doesn’t put any shortcuts into the Start Menu or on the Desktop, but the default install directory for the program is “C:\Program Files\MentorSoftwareCO\CountyLookup\”, and the executable is “CountyLookup.exe”‘. Run the program, and use the drop-down selections to choose the state and county you’re interested in:
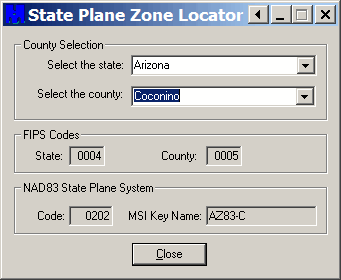
The State Plane system ID info (NAD83 only) will show up at the bottom, in this example AZ83-C (AZ Central, NAD83). You also get the state and county Federal Information Processing Standards (FIPS) codes.
LIDAR (Light Detection and Ranging) can be used to create high-resolution terrain data (sub-meter), detail good enough to show individual man-made features like buildings and bridges. It’s especially useful for analyzing terrain in areas that are in constant change, like coastlines. High-resolution coastal LIDAR data is available at this NOAA website for the entire US ocean coastline, and parts of the Great Lakes coastlines, for times ranging from 1996 to the present.
Continue reading ‘LIDAR Data Coastal Erosion And Flooding Analysis Using MicroDEM’
Most handheld Garmin GPS units come with a baseline road map that displays major roads for either the Eastern or Western hemisphere, plus the ability to display greater detail using uploaded map data. Garmin sells a line of CD/DVD disks with data for various parts of the world, and third-party sources offer maps with greater details for specific countries (a Google search should reveal even more). Many of these datasets are expensive, and data is unavailable for some areas of the world. There’s a cheaper option that offers worldwide data, including coverage of areas not covered by commercial products, but with some limitations in quality and detail.
Continue reading ‘Cheap Worldwide Road And Contour Maps For Garmin GPS Units’

