

Swivel is a site where anyone can upload data of any kind in tabular or spreadsheet form for general public access, and plot it in a variety of graph formats. Today at Where 2.0, they will announce the new capability of plotting geographic data in Google Maps. See the Webware article for more information and a screenshot. Another more flexible option for this kind of display is Google Map Creator, which creates thematic shapefile maps in Google Maps, but Swivel seems like it may be easier to use.
Author Archive for Leszek Pawlowicz Page 57 of 79
Yesterday’s post showed how to create a sea level rise flooding animation in Google Earth, like this one:
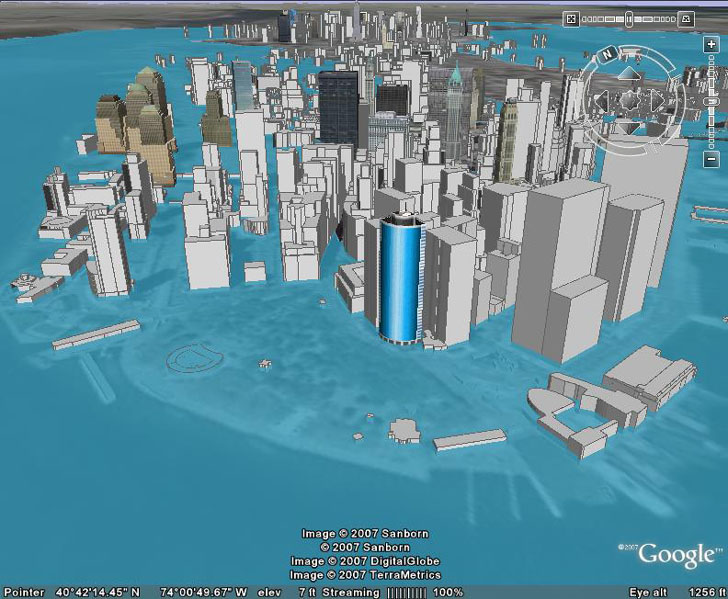
But if you downloaded the KMZ file used to create this animation, and ran it with 3D buildings turned on at the tip of Manhattan, the final image you’d get with 12 meters of flooding looks like this:
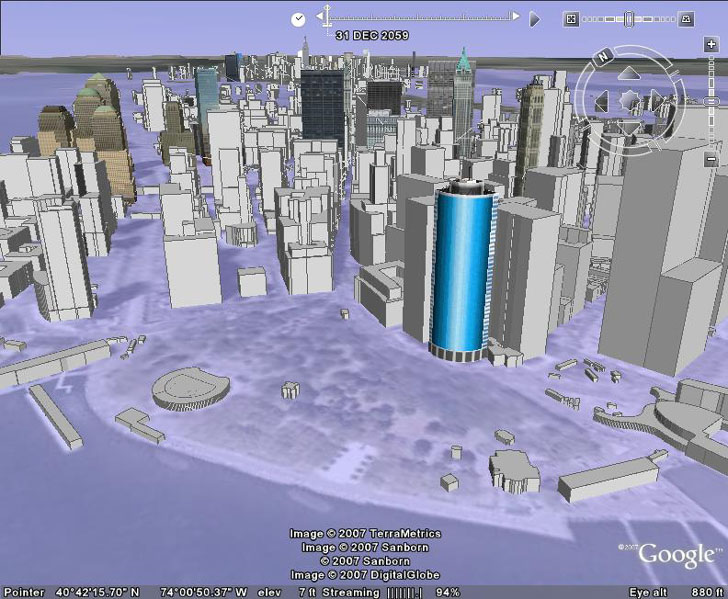
And there’s a problem with the accuracy of this image: there’s no actual depth to the flooding, i.e. the lower levels of the buildings aren’t covered with water. In fact, some of the buildings you can see in the view above would be completely covered with water if this were a more realistic depiction. That’s because no absolute altitude was assigned to the image overlays used in creating the animation, so they are “clamped” to the terrain level. But by assigning a height to every overlay image in the animation, one can create a realistic effect where the flooding doesn’t just cover more area as the sea level rises, but covers the bottom levels of some buildings, and completely covers other ones. This would be similar to the animations shown in the movie “An Inconvenient Truth”, and in one sense even better. In that movie, the flooding was show in overhead views, while the Google Earth animation can be viewed at an oblique angle of your choosing, with 3D buildings.
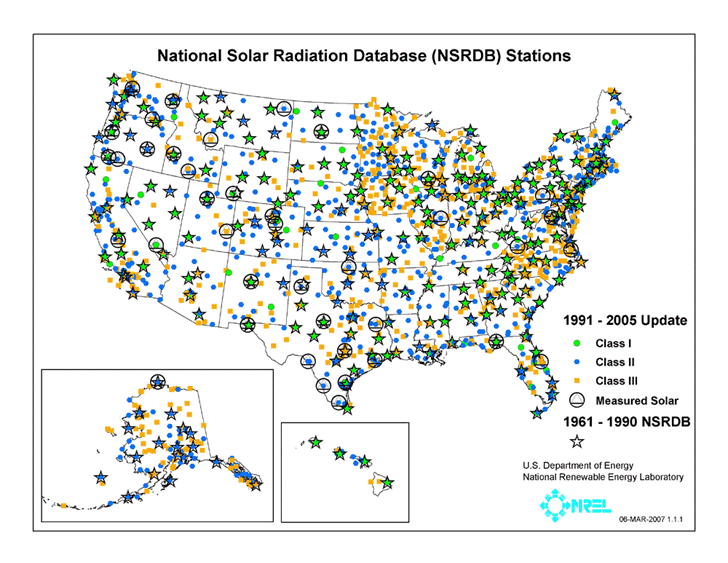
The National Solar Radiation Database offers solar radiation data and limited meteorological data for 237 sites in the US over the period 1961-1990, and expanded data for 1454 sites from 1991-2005:
Data includes:
- Daily Statistics Files
- Hourly Statistics
- Threshold Files
User manuals in PDF format can be downloaded. Data is in text format, but can be converted to spreadsheet format with a bit of work.
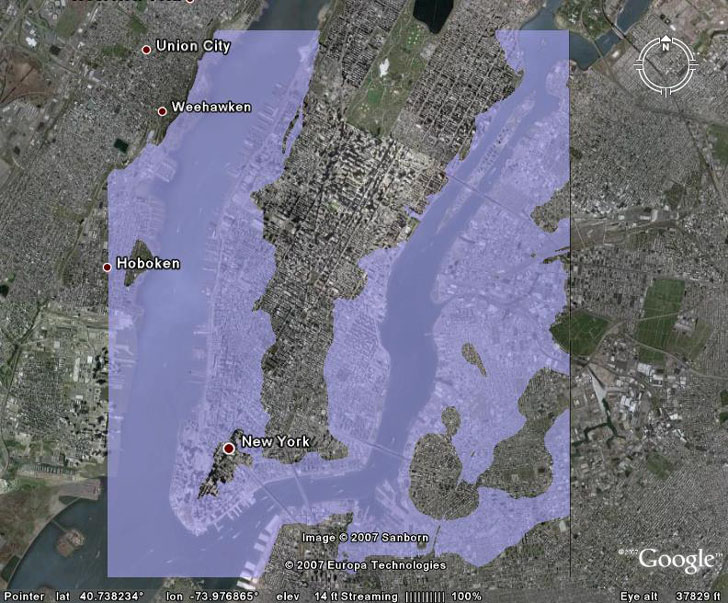
Creating a high-resolution static sea-level rise image for a specific sea level rise value, and displaying it in Google Earth, is fairly straightforward (see these three posts for the details):
But creating an animated version viewable in Google Earth, comparable to this animation created in MicroDEM …
… takes a bit more work, including diving into the KML code. But while it’s a bit time-consuming, it’s not that hard, and the results are worth it:
Addendum: Do read the rest of this post, but also check out the next post in the series as well for even cooler effects.
Continue reading ‘High-Resolution Sea Level Rise Flooding Animations In Google Earth’
This is a minor addendum to the previous post on creating and placing arbitrary raster graphic images and symbols into Google Earth using GIF/PNG transparency. As my chicken scratch writing sample showed, creating quality raster graphic symbols can be a challenge for some, and while there are tools in most raster graphic editors to create high-quality test, shapes and symbols, vector drawing programs usually do a better job on those. It’s possible to use a slightly-modified version of the process in the previous post to bring symbols drawn in vector graphic software into Google Earth.
1. As before, export in image format the area of Google Earth you want to display custom graphics on top of, recording the bounds of the image.
2. Import this graphic jpg image into a vector drawing program. Adobe Illustrator is the best-known COTS program for this, but if you search around, you can find several free programs that do similar things. Examples include Inkscape, a simple, free and open source solution, and Creature House Expression 3, a commercial program now available for free that is very powerful, but has a steep learning curve.
3. Mark the corners of the imported graphic with some kind of symbols; you’ll need these as a guide to cropping later on.
4. Add your vector objects in the appropriate position on top of the raster graphic image from Google Earth.
5. When you’re finished adding vector objects, delete the raster graphic image, leaving behind the vector objects.
6. Export this image as a raster graphic (check your help file to find out how). You’ll get the best results by saving it in a lossless format like TIFF, PNG, or GIF (the last only if the image has less than 256 colors).
7. Open the new raster graphic image in your favorite raster graphic editor, and crop it using the bounds from step 3 as guides.
8. If the resulting cropped raster graphic image is large (greater than 2000 x 2000 pixels), Google Earth may have trouble dealing with it; use the resize function to shrink it down, then save it
From this point on, just follow the steps in the previous post to convert this graphic image to a GIF/PNG file with transparency, and then to place it correctly in Google Earth. Unlike the raster graphic example in the previous post, you may have to move and stretch the image a bit to get it place correctly, depending on how accurately you were able to crop it in step 7.
In the last post, GIF/PNG transparent colors were used to improve the appearance of Google Earth image overlays showing sea level rise flooding. But there are lots more ways to use transparent colors with image overlays to give you extra freedom in adding graphics to Google Earth; here are two examples.
Continue reading ‘Using GIF/PNG Transparency In Displaying Raster Graphics In Google Earth’
In the last post, a raster image overlay of 8 meters of sea level rise flooding was loaded and positioned into Google Earth:
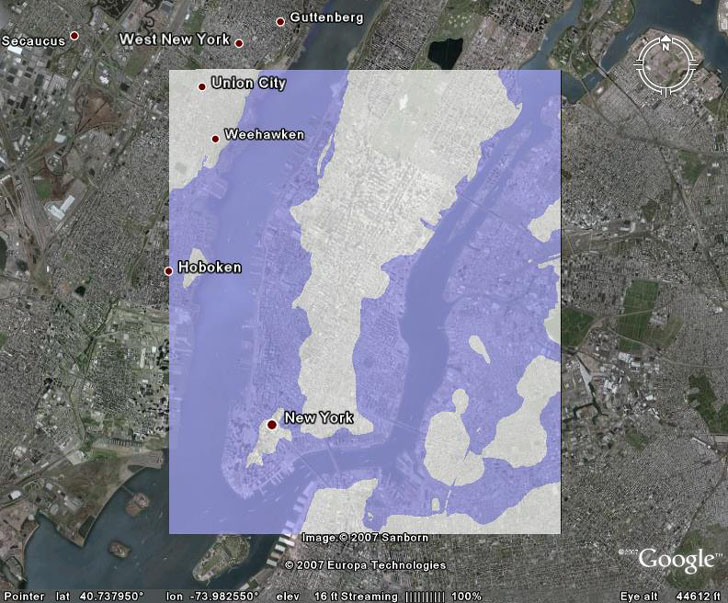
But the white areas of the original raster image obscure the underlying aerial photography, even when the raster image is made partially transparent. It would be useful to make that original white area completely transparent, while preserving the blue areas that represent areas flooded by the sea, and that can be done in Google Earth.
Continue reading ‘Adding Color Transparency To GIF/PNG Google Earth Image Overlays’
In a previous post, a vector-based KMZ file was created to show the effects of 8 meters of sea level rise on the Manhattan area:
If you read the earlier post, you’ll see that it’s a fairly convoluted process to convert a raster graphic image into a vector KML format, involving multiple steps that may not be that straightforward for a GIS newbie. But there’s an alternative path: take the original raster graphic image, and import that into Google Earth as an image overlay. This post will show specifically how to do that for the sea level rise image, but the process can be used with any generic image overlay.