In a previous post, a vector-based KMZ file was created to show the effects of 8 meters of sea level rise on the Manhattan area:
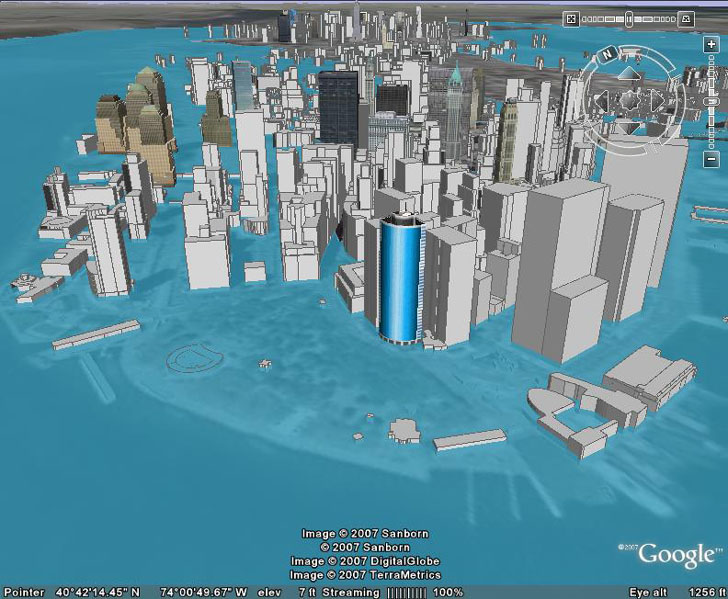
If you read the earlier post, you’ll see that it’s a fairly convoluted process to convert a raster graphic image into a vector KML format, involving multiple steps that may not be that straightforward for a GIS newbie. But there’s an alternative path: take the original raster graphic image, and import that into Google Earth as an image overlay. This post will show specifically how to do that for the sea level rise image, but the process can be used with any generic image overlay.
Here’s the raster image from the previous post showing the areas that would be covered by water in the Manhattan area following an 8-meter rise in sea level, created using the program MicroDEM:
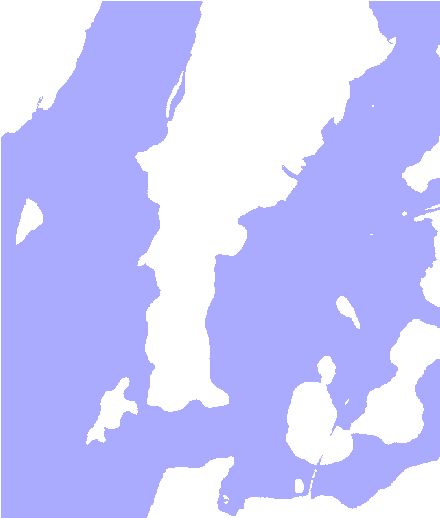
Save this as a standard map image by using the File => Save map as image command in MicroDEM. You can use either suboption: “With world file” saves it as a BMP file with a BPW worldfile, while “As GEOTIFF, screen scale” saves it as a georeferenced TIF file. Although you don’t need to, it will be very helpful when applying the overlay in Google Earth to know the geographic bounds of this image in both latitude and longitude. That’s easy to do in MicroDEM using the Calculate => Map window corners command. For this image, the latitude extents are N40.7828099 and N40.6931465, while longitude is W73.9324768 and W74.0325733.
One final thing to keep in mind is that graphic image overlays in Google Earth can use up huge amounts of RAM and system resources, and Google recommends that you keep the image size smaller than 2000 x 2000 pixels to minimize the system strain. You can get around that problem with image tiling, but that’s a topic for another set of posts.
Open up Google Earth, zoom in to the approximate location for the overlay, and load in the GIF image created above (use File => Open, or click on the “Add Image Overlay” button on the toolbar on the top). In the main map window, I see this:
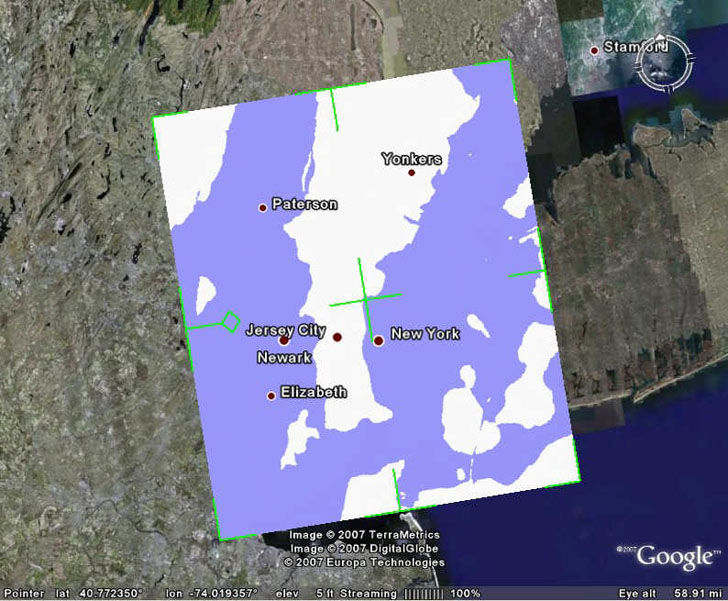
The green lines overlaying the image are controls that let you adjust the overlay to match the Google Earth data underneath:
- Center green cross: Move the mouse cursor to center of the cross, where it will change shape, then click and drag on this to move the overlay around relative to the underlying map
- Edge green half-cross: Move the mouse cursor to this point until it changes shape, then click and drag to stretch the map in one direction to fit the underlying map
- Corner green angle: Move the mouse cursor to this point until it changes shape, then click and drag to stretch the map freely in X and Y to fit the underlying map
- Green diamond: Move the mouse cursor to this point until it changes shape, then click and drag to rotate the overlay around the center point.
I could use these operations to get the overlay to fit in the right location and size in Google Earth, but I don’t have to; Google Earth lets you enter the latitude and longitude bounds of an overlay in the overlay properties window, and then positions it automatically. By clicking on the “Location” on the properties window, and entering the bounds recorded earlier …
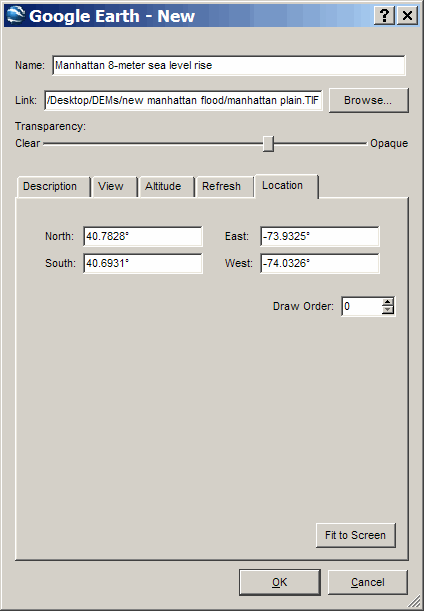
… Google Earth will now position and stretch the image to fit in the exact correct geographical location. I can also enter a title now in the properties box, enter a description, and set the transparency to some level where I can see the aerial imagery at least partially through the graphic overlay. The result in Google Earth looks like this:
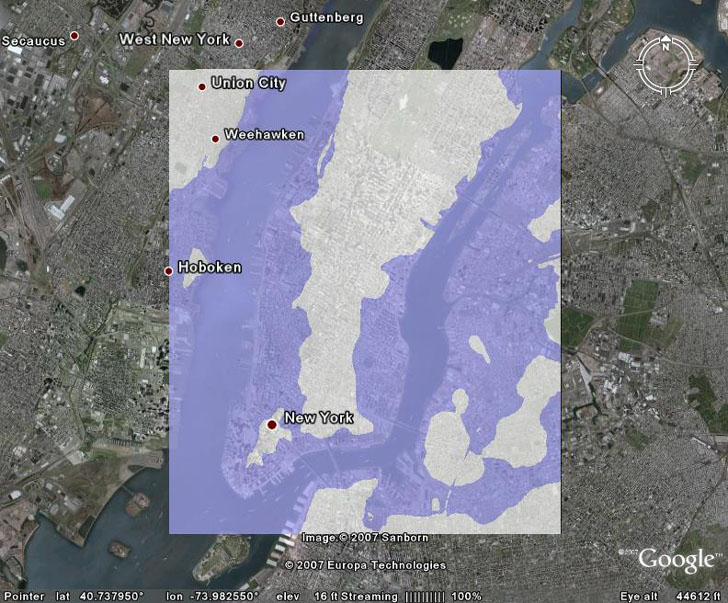
I saved this data in KMZ format, which includes the overlay image, and you can download it here. If I were to save it in KML format, the image overlay data would have to be loaded in from the original graphic file on my computer, meaning that I can’t just send the KML file to someone else and have them be able to see the image on their computer.
This is a simpler process than converting the raster image to vector format, but if you compare the raster overlay picture above to the vector data…
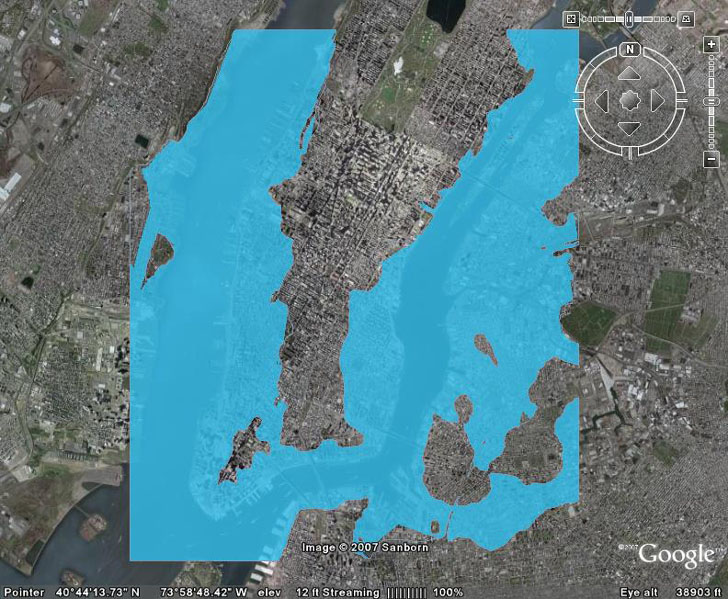
…you’ll see one advantage of the vector data – the areas above water aren’t obscured the same way they are in the raster image. But there’s a way to make the parts of the raster image that represent dry land areas transparent, and I’ll cover that in an upcoming post.
Thanks, Leszek. Very nice comparison and manual.
2 days before Google present near tools to GMaps. http://gisplanet.blogspot.com/2007/05/official-google-maps-api-blog-v280.html
I hope see this in MyMaps also.