While its primary functions deal with DEM/terrain display and analysis, MicroDEM has some handy cartographic functions as well for any position on a georeferenced map. It can calculate the amount of shift in position between different datums for both UTM and geographic coordinates; determine the current angular variation between true and magnetic north; find the deviation from true north for the UTM grid, and label sunrise/sunset/twilight times for multiple points on a map.
More after the fold …
Continue reading ‘Cartographic Utilities In MicroDEM: Datum Shift, Magnetic Declination, UTM Grid Deviation From True North, And Sunrise/Sunset/Twilight Times’
SAGA GIS (System For Automated Geoscientific Analyses) is a free raster/terrain-oriented GIS program (some vector functions), with a modular structure that makes it easy to add additional capabilities. After being in release candidate mode for about a year, the final official version 2.0.0 was released about two weeks ago, replacing the previous version 1.2 stable release. Probably the biggest change is the move from Windows-only to a multi-platform release supporting both Windows and Linux. A quick examination of the module packages shows that a few new modules have been added, but most are unchanged. However, module management has been significantly improved with the addition of a “Modules” tab to the Workspace window, and in general it’s easier to pull up data in the new version.
Best of all, there’s been a huge improvement in documentation. Version 1.2 had a good introductory 200-page manual that’s still worth downloading and reading, but many of the modules had virtually no documentation at all. Version 2.0 now has a terrific 400-page manual, available at the SourceForge download page along with a copy of the demo data used in the manual. And while even the manual doesn’t cover all the functions of the different modules, clicking on a module in the “Modules” window and then clicking on the module’s “Description” tab brings up a cursory description of the module and the input parameters. While it will still take some time to figure the module’s operation out, that’s still better than the way it was with version 1.2. A listing of the available modules is at the bottom of this post, after the fold.
It’s a good thing there are now two good manuals, because program function takes some getting used to. SAGA uses its own raster grid format (.sgrd for version 2.0), so grids in other formats have to be imported into the program (and exported into other formats as well). Setting parameters for individual data layers also takes some getting used to. But given the huge number of module functions available in this program, it’s worth spending some time figuring out how to use it. I hope to cover some of the modules not documented in the manuals in future posts (I’ve already covered using SAGA to convert raster graphics to shapefile format in this post).
A list of modules in SAGA 2.0 follows below the fold (taken from the user manual).
Continue reading ‘SAGA GIS 2.0 Released’
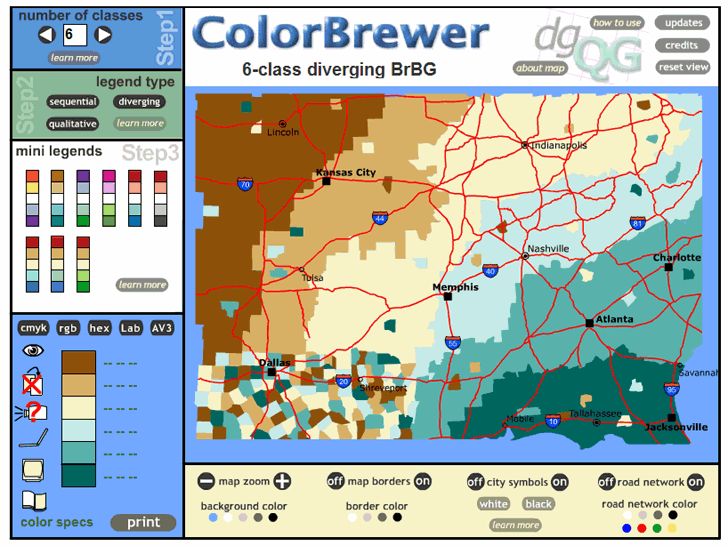
When creating a thematic map where color represents different attribute values, there’s always the question of whether the color scheme you’ve selected will look good. and more importantly whether it will convey the information you’re trying to represent to its audience. Trial-and-error is one approach, but the ColorBrewer is a Flash web applet which lets you interactively experiment with different color schemes to see which ones work visually (and which ones don’t). It was created by Professor Cindy Brewer of Penn State University, author of Designing Better Maps: A Guide for GIS Users, and will run in any browser with Flash support.
ColorBrewer doesn’t actually display any of your data – it uses a dummy map of what appears to be counties in the US Southeast to plot different color schemes in sequential, diverging or qualitative fashions. It’s not intended as a data plotter, just to evaluate the visual impact of different color schemes. Inputs include:
- Number of classes
- Sequential, diverging or qualitative schemes
- Mini-legends (pre-built color schemes)
- Turning map borders, city symbols, road networks on and off
- Selectable colors for map borders, city symbols, road networks, and the map’s background color.
Here’s a screenshot of the application in action (click on the image for a larger view):
Mike Mahaffie writes to say that the National States Geographic Information Council (NSGIC) has just started up a new blog, posting on geographic issues of interest to state governments. The main NSGIC website is worth a look as well, to see what projects and initiatives are currently under way. From the NSGIC website About page:
“The National States Geographic Information Council (NSGIC) is an organization committed to efficient and effective government through the prudent adoption of geospatial information technologies (GIT). Members of NSGIC include senior state geographic information system (GIS) managers and coordinators. Other members include representatives from federal agencies, local government, the private sector, academia and other professional organizations. A rich and diverse group, the NSGIC membership includes nationally and internationally recognized experts in geospatial information technologies, data creation and management as well as information technology policy.”
I posted earlier about a.placebetween.us, a site that lets you enter two addresses, then finds a business of a specified type located about halfway between those locations as a convenient meeting place. GoogleMapsMania posts about a similar site called Mezzoman that does essentially the same thing. It’s a bit more convenient to use in entering the addresses compared to a.placebetween.us, but has a smaller map window with less flexible map controls (i.e. no zoom slider, just Zoom In/Out buttons). The initial drop-down business type selector is limited, but you can enter the business type of your choice in the Google Search box that appears after you click the “Mezzoman Go!” button.
Edited 6/13/07 to fix mistake pointed out in comments (thanks, Moawall!).
From the Yahoo Research Labs comes Zurfer, a mobile phone application that gets your location from the nearest cellphone tower, and pulls in geotagged photos for that general area from Flickr. Also retrieves photos from your friends, and lets you upload pictures from your cellphone to Flickr. Currently only runs for sure on a limited number of cellphone models; Yahoo says it runs on:
“Nokia Series 60 v2 and v3 phones: N73, N95, N80, 6682 and N70. It should work on most Nokia Series 60 v2 and v3 phones, but your mileage may vary. It also runs on the Motorola RAZR V3x. It may work on other phone models.”
They also recommend that you have an unlimited data plan, since this application will suck down data like crazy. Requires you to sign up for a free ZoneTag account so that it can figure out where you are.
Via Download Squad.
Yes, it’s true – you can get a fully-functional version of ESRI’s ArcGIS 9.2 for free, along with many of the extensions (3D Analyst, GeoStatistical Analyst, Survey Analyst, and more). The base version of ArcGIS costs about $1500, and extensions can run $1500 apiece. You can also get a fully functional version of ArcPad, ESRI’s mobile data acquisition and mapping GIS program for handheld GPS units that run Windows Mobile or Windows CE.
Of course there’s a catch – several in fact. For the evaluation version of ArcGIS:
- This is a 60-day demo version only. It’s fully-functional, but stops working at the end of that time, and uninstalling/reinstalling the software won’t extend the evaluation period.
- You only get a single evaluation license number with each copy; installing it on a different computer won’t re-start the evaluation process.
- You can’t install it on a computer that already has a licensed copy of an earlier version of ArcGIS. Different versions of ArcGIS don’t play together well on the same computer.
- Finally, if you’re not familiar with the basics of ArcGIS, it’s probably not worth your time to request a copy and install it on your computer. ArcGIS and its extensions are a handful to learn and use, and it’s too hard to learn the program with just the software itself, especially in just 60 days. For that purpose, you would probably be better off with a book like GIS Tutorial: Workbook for ArcView 9.0 (GIS Tutorial series), which includes not just learning material, but also a copy of ArcView 9.0 good for 180 days. Or, if you’re a fast learner, along with the evaluation version you could get a copy of an ArcGIS learning textbook like one of the following:
For the evaluation version of ArcPad, the limitation is more basic: the program is fully functional, and doesn’t expire, but times out every 20 minutes. For many field data acquisition applications this might not be acceptable, but for those where data takes only a few minutes to acquire, you might be able to live with that 20-minute time limit indefinitely. At the very least, the evaluation version will give you all the time to learn the ins and outs of the software, and determine whether it meets your needs. If not, I’ll be covering a freeware PDA-based field data acquisition system in the future.
Edited to correct “ArcGIS 7.2” to “ArcGIS 9.2”; even free, 7.2 wouldn’t be worth it. Thanks, James!
Zonums Solutions has a new free online utility called “Color Your Map” that lets you create a custom KML file representing a country as a filled-in polygon with a specifiable color. For some countries, you can break the representation down further by subdivisions such as province or state, and for the US, you can create state polygons broken down by county.
Continue reading ‘Colored Country/Subdivision Google Earth Polygons With "Color Your Map"’


