blankblank blank


Author Archive for Leszek Pawlowicz Page 39 of 79


Altitudes And Terrain Profiles In Google Maps

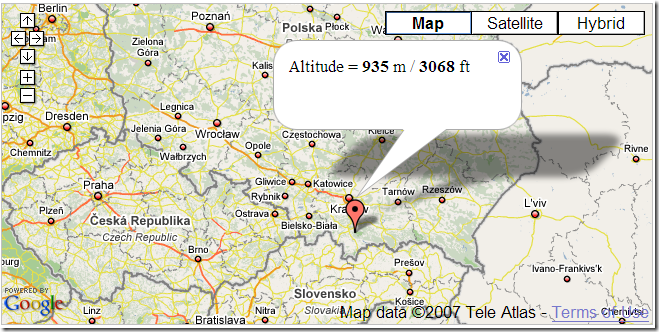
As a demonstration of their altitude information service, the Topocoding API website has a Google Maps demo. Click on a location on Google Maps, and get a placemark with altitude information for that point:

altitude

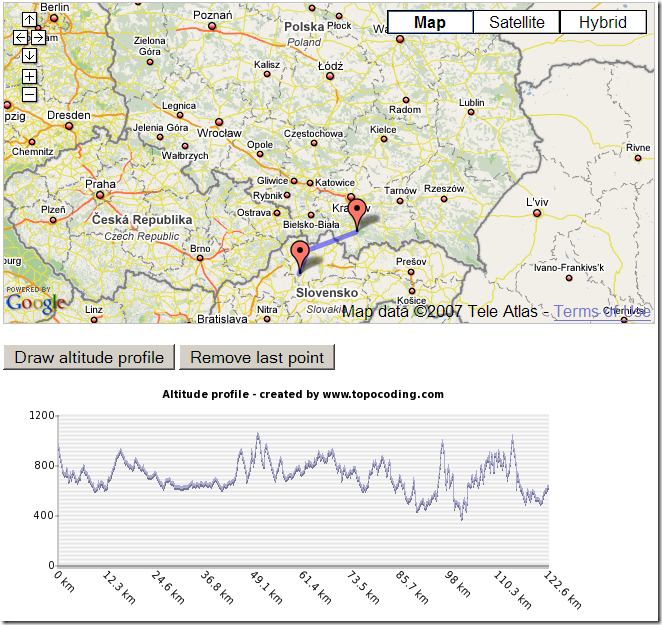
Click multiple points to get a path, and you can then generate a terrain profile for that path:

profile

It uses a combination of SRTM-90 data (roughly 90-meter resolution), and GTOPO30 (1-kilometer resolution) where other data is missing. All continents except Antarctica are included.

They’ve also created an XML Google MyMaps tool that you can add to your collection of MyMaps mapping functions; click on this link, and then click on the appropriate button to add it to your MyMaps collection.


Mapping Zip And Area Code Boundaries, And More

The USNaviguide website has an assortment of Google-Maps-based services for mapping the boundaries of various geographic parameters:

Zip Code: Enter a 5-digit zip code, or the first three digits of a zip code, and get a map of the area covered by that zip code. Or click on the map, and get a map of the all the zip codes in that area, with a placemark at the location you clicked on with the zip code for that area in the info bubble:

clickzips

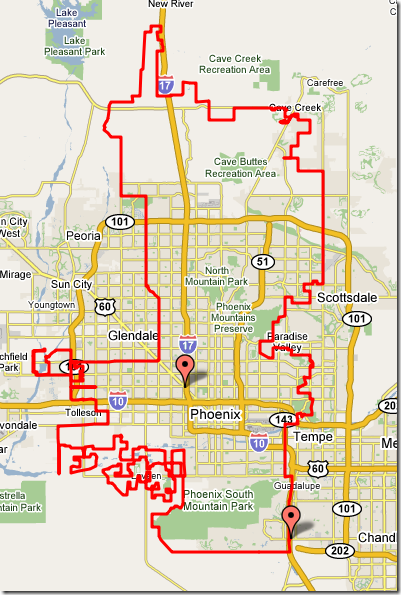
City/town boundaries: Enter a zip code, or click on the map, and get the boundary of the city/town jurisdiction for that area where appropriate:

phoenix

County/FIPSCSA: Enter a zipcode, or click on a spot, and get a map similar to the one above for either a county or a FIPS (Federal Information Processing Standard) Core-Based Statistical Area, with a placemark near the center of the polygon with the relevant information, including code numbers.

There is also a US geocoders (get a latitude/longitude for an address), and a reverse geocoder (enter the lat/long or click on an address, and get back the closest addresses to a point).

The related Maps.Huge.Info site has links to most of the above services, but also a few more as well:

  • US telephone area code maps
  • Plotting zip codes by line boundary instead of overlay map (as at the top)
  • Australian post codes
  • A zip+4-based reverse geocoder

Finally, there’s a page of the free PERL code they use for converting a polygon of points into a Google Maps polygon.

Via GoogleMapsMania.


Historical Census Data From the National Historical Geographic Information System

The National Historical Geographic Information System (NHGIS; free registration required for access) offers historical census data from the first census (1790) to the most recent. The types and extent of the data depend on the census year, with more data typically available from more recent census years. Data can be accessed for the entire country, by state, county, census tract, or other divisions where available, and can be downloaded in a number of different spreadsheet and GIS-compatible formats. The site also has shapefiles for the states/territories, counties, and census tracts appropriate for each census year. Online mapping of, and access to, some of the data from 1940 on is available for free at the Social Explorer website; Social Explorer offers full access to much more data and online maps as a paid service.


More Online Historic Maps

A short followup to my earlier posts on large-format downloadable historic maps and online historic map collections:

American Geographical Society Library Digital Map Collection: Based at the University of Wisconsin – Milwaukee, the collection currently holds 200 online maps, with more on the way. Strongest in maps of Wisconsin and the surrounding area, but has an assortment of maps for other locations as well. No download links for maps.

Hat tip to Nina Frantzen in the comments.

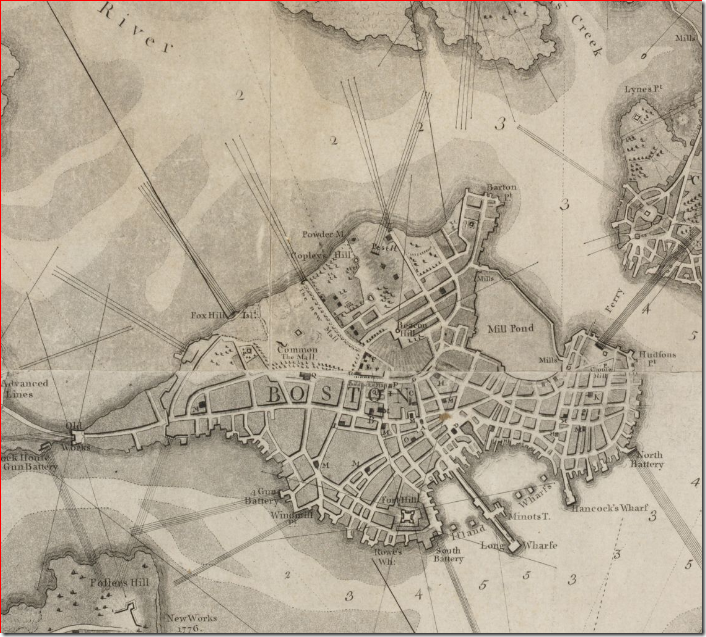
The Boston Public Library’s Norman Leventhal Map Center has strong holdings in maps of Boston, Colonial New England and the American Revolution, but also collections of some of the earliest printed maps, and European/Dutch maps from the Age of Discovery.


1777  Boston map Detail from map of Boston (1777) 

Via GeoCarta Blog.


Historic Cities: Historic maps of cities from the Hebrew University of Jerusalem and the Jewish National University Library; catalogued by city and country. Also links to city maps at other websites.


Broer Map Library: Historic and modern maps from around the world in a Zoomify interface. Also includes links to historic maps in Google Earth KMZ format.


Another useful gateway is the Map History / History Of Cartography site.


Tiling And Printing Large Maps To Scale On A Small Printer

A previous post dealt with printing maps larger than a printer’s biggest paper size (Printing Large Maps On A Small Printer). The solution was to split the map image into smaller tiles to be printed separately, to be cut and taped together to form a larger whole. But what if you want to print such a larger map at a specific scale, like 1:24,000? Tiling and printing a map to scale using the options described in that post would be a major pain – you’d have to calculate the correct image size, and then resize the pixel dimensions of the image to get it to print that size. You might even have to add additional blank space to the map edges to get everything to work out.

The program MicroDEM has the ability to automatically tile and size a map image to a specified map scale and paper size, and then print it out on multiple pages for you. Open a georeferenced image in MicroDEM (like a GeoTiff, or a standard graphic format with a world file), and then zoom the image using the 1:1 toolbar button at the top of the map window:

zoom1to1

If you don’t zoom to the full 1:1 pixel dimensions, the image will be printed at the original screen scale, which will make the printed version highly pixelated. Next, click on the Print toolbar button:

print

and select “Print preview & print to scale” from the drop-down menu. You’ll get a window like the following:

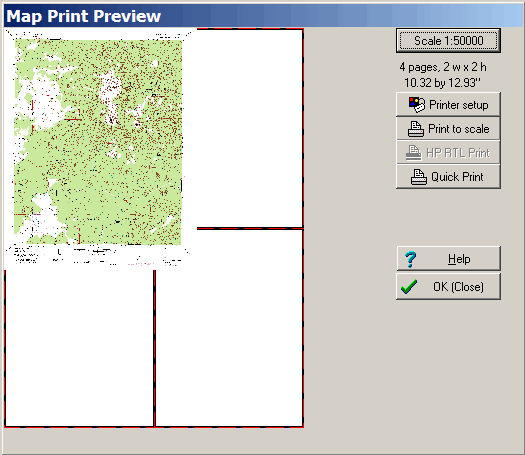
PrintPreview1

In the upper right-hand corner, the current map scale setting is shown, along with the number of sheets of paper that will be required to print the map at the current paper size setting, and the map size in inches printed at the specified scale. At the left, the map image will be displayed as it will be printed on the sheets of paper represented by the rectangles outlined in red.

To change the scale, click on the button that displays the scale, and enter the desired number. To change the paper size or printer settings, click on “Printer setup” and make the desired adjustments. In particular, try experimenting with portrait vs. landscape orientation to see if you can fit a map on fewer sheets of paper.

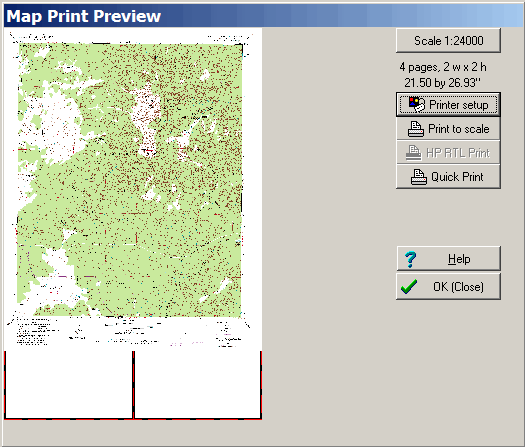
So if I change the scale of the original map above to 1:24,000, and set the paper size to 11″ x 17″, the window will now look like this:

printpreview2

Click on the “Print to scale” button, and MicroDEM will slice up the map and print it on the specified number of sheets. It can take a while (scratch that, it can take a loooong while) to process the data and print it out, especially for large images; a fast processor and a large amount of memory will help with that. The options described in the post Printing Large Maps On A Small Printer might not be able to print to scale easily, but they do print the tiles a lot faster than MicroDEM does. When the tiles have been printed, cut the blank edges off the appropriate ends of the tiled map pages, then tape them together to create the full map print. Since there’s no image overlap, you’ll have to be careful when trimming them not to remove parts of the printed image, otherwise they won’t fit together exactly.

You can also use this approach along with PDFCreator to generate PDF files of scaled map prints, to be sent to a computer or print service capable of handling larger paper sizes directly.


Creating Google Earth Screen Overlays With EarthPaint

Last week, I covered my KML Screen Overlay Maker utility, which simplifies the job of converting graphics into Google Earth screen overlays. It occurred to me that this utility could be used in conjunction with the free utility EarthPaint to create screen overlays. I’ve covered EarthPaint before – it’s a useful tool for creating Google Earth ground overlay files using vector-graphic-like drawing tools (lines, circles, ellipses, polygons, text, etc.). But the graphic file it generates can be used along with the KML Screen Overlay Maker to create a screen overlay instead of a ground overlay.

1. Start up EarthPaint; Google Earth will start up at the same time.

2. You’ll be given the option to either use the current location in Google Earth, or set a new one. Doesn’t matter which one you choose, since you’ll be creating a fixed screen overlay.

3. EarthPaint will load in a black-and-white image of the current view in Google Earth. Use this image as a guide as you draw the elements you want in your screen overlay, with the edges of the image defining the limits of the screen overlay graphic. There’s more info on this in my original EarthPaint post.

4. When done, click on Create => Send to Google Earth. You’ll be asked to enter a name for the overlay graphic; after clicking OK, the graphic image you created in step 3 will be opened in Google Earth as a ground overlay. It’s a GIF file with transparency, which makes it perfect for creating a screen overlay.

5. Go to the program directory for EarthPaint (default is C:\Program Files\EarthPlot Software\EarthPaint. Open the “Cache” subdirectory, and look for a GIF file that has the name assigned in step 4. Copy this GIF file to another location.

6. Start up the KML Screen Overlay Maker, and select the GIF graphic file from step 5.

7. Leave the Overlay Size units, x and y, as fraction, and enter “1” for the value of both of those. This will automatically resize the overlay graphic to fit to the edges of the view in Google Earth. Leave everything else as is.

8. Save the file, and then open it up in Google Earth (with the Network Link option in KML Screen Overlay Maker if you want). You should now see the graphic image created in step 3 as a screen overlay that doesn’t move as you change the view in Google Earth.


KML Circle Generator

Site appears to be down; try the GE Path program as an alternative.

KML-Circles is an online app that creates open or filled polygons around a specified center point. With the default number of 60 vertices, you essentially create circles, but by selecting a small number, you can create other polygons (e.g. 3 for a triangle, 4 for a square), but with no control over their orientation. It operates in two different styles:

Continue reading ‘KML Circle Generator’


KML Screen Overlay Maker Utility, Concluded

Continuing on from yesterday’s post about my utility to create Google Earth screen overlays …
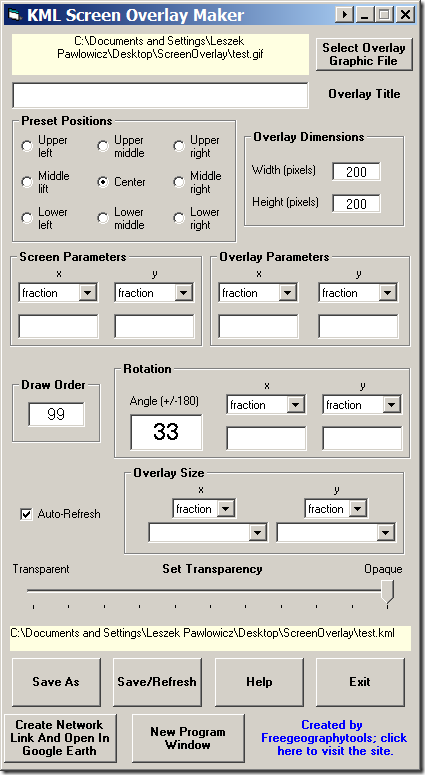
ScreenOverlay

Rotation: Sets the rotation angle and axis. The angle needs to be between -180 and +180, and counter-intuitively clockwise is negative, counterclockwise is positive. Default (and blank) is no rotation. The “x” and “y” sets the position of the rotation axis for the image relative to the lower-left-hand corner of the image. Leaving this blank sets the rotation axis in the center of the image. Units, selected by the dropdown, are:

  • fraction – The fraction across the image screen where you want the reference point, e.g. 0.5 is halfway across the image. Can be greater than 1 or negative, which sets the rotation axis outside of the image.
  • pixels – The pixel position for the origin measured from the lower left-hand corner of the screen. Can be larger than the image size, or negative, which sets the rotation axis outside of the image.
  • insetPixels – Similar to pixels, but measures from the upper-right-hand corner of the screen. Can be larger than the image size, or negative, which sets the rotation axis outside of the image.

Auto-Refresh: See the Save/Refresh section below for info on this

Overlay size: This sets the size of the overlay image on the Google Earth screen. The default, with the data blank, uses the native pixel size for the image. The top dropdown sets the units, either fraction of the Google Earth screen size or pixels. In the bottom dropdown, you can enter the desired fraction or pixel size, but you also have two dropdown choices:

  • Maintain native size: Keeps that dimension at its original size in pixels, regardless of the units set above;
  • Maintain aspect ratio: As you change the other dimension, this dimension will be scaled up to maintain the image’s aspect ratio. This will keep the image from getting grossly distorted in one direction as you increase or decrease its size in the other direction.

Set Transparency: Sets the overlay transparency from fully transparent (invisible) at the left slider position to fully opaque at the right.

Save As: Lets you select the screen overlay KML filename and save it; filename is displayed in the yellow box above the button. Once you’ve saved a file once, the next two buttons are enabled.

Create Network Link And Open In Google Earth: Clicking this button creates a network link to the KML screen overlay file, and loads it in Google Earth (if Google Earth is not installed in its default location, you’ll be prompted to specify where the Google Earth executable is located). This will display the last saved version of the overlay in Google Earth, and update that view every second. So if you change any of the parameters, and then click the Save/Refresh button, one second later the modified screen overlay will show up in Google Earth, letting you see the effects of the change immediately.

Save/Refresh: If you change any of the parameters and want to save them under the same filename, click this button. If you have created a network link using the above button, the screen overlay in Google Earth will also be refreshed/updated with this button. If you have the Auto-Refresh box checked, the overlay will be saved automatically under the current filename any time you change a parameter, and you won’t have to keep clicking the Save/Refresh button to update the overlay in Google Earth. This can be useful in the final stages of tweaking the results, but you might want to have this turned off in the early stages lest it drive you nuts.

New Program Window: If you want to put multiple graphic elements into Google Earth at once to see how they’ll look relative to each other, clicking this button will open up another program window so that you can create multiple screen overlays at the same time. Once you’ve created the individual screen overlay KML files, you can open them all and put them into a single Google Earth folder to keep them together.

Help: Brings you to the posts on this blog (the lazy programmer’s help page)

Exit: Guess …

Don’t forget that the KML screen overlay file you’ve created references the graphic to its location on your hard drive. If you want to create a portable screen overlay file that you can send to someone else, you should save it in KMZ format from Google Earth.

That’s it. Download the small executable file here, or the much larger full install file here. As usual, use at your own risk, and report bugs/quirks to me. The alpha testers didn’t indicate any serious problems, and the program doesn’t alter any of your original data, so problems should be minimal.

Other free utilities can be found on the Utilities page. If you find this or any of my other utilities particularly useful and would like to show your appreciation, donations of any amount are gratefully accepted via PayPal.