blankblank blank


Author Archive for Leszek Pawlowicz Page 40 of 79


The KML Screen Overlay Maker Utility

Yesterday’s post dealt with the basics of what a Google Earth screen overlay is, and some of its possible applications. But you can’t create or edit a screen overlay in Google Earth, so until now you’d have to create it in KML with a text editor or stand-alone KML editor. I’ve written a small utility for Google Earth that lets you create a screen overlay from a graphic file for Google Earth with a GUI, and also lets you modify the parameters and see the changes in the screen overlay immediately in Google Earth.

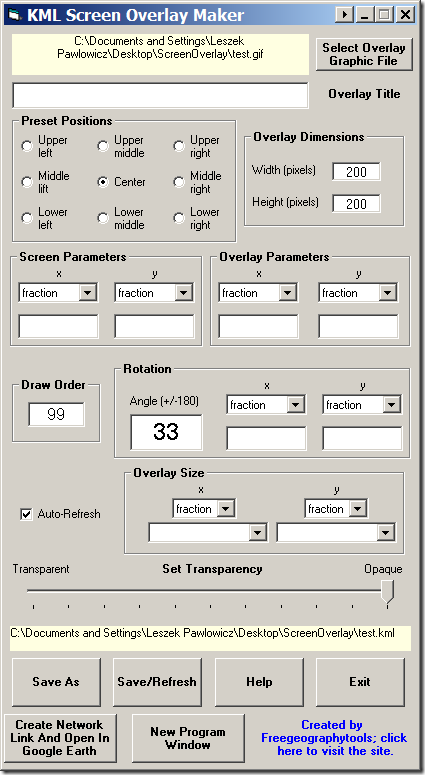
You can download the small executable file here, and it will probably work fine as is. If you get error messages about missing files, or if you want the full install with a Start Menu item, you can download the full install package. Here’s the program interface:
ScreenOverlay

The unusual aspect ratio (taller than it is wide) is so you can drag it to the left side over the Google Earth view, where it will block less of the globe and overlay view. This may help you better see the effects of modifying screen overlay parameters.

The various option sections, from top to bottom:

Select graphic overlay file: Click on the button to choose the single graphic file to use as an overlay (if you want multiple graphic images in your Google Earth screen, you can create multiple screen overlay files and load them all into Google Earth). Supported graphic formats are TIF, BMP, JPG, GIF, PNG, TGA, PGM, DDS and PPM; transparency is supported for GIF and PNG files. As soon as you select a graphic file, the “Save As” button will be enabled; saving the screen overlay without changing any of the parameters will place the graphic image in the center of the Google Earth screen at its original pixel dimensions. The full filename (with path) will be displayed in the yellow box.

Overlay title: This is the title that will be associated with the overlay in the Google Earth Places pane at left.

Preset positions: Enters preset parameters to position the graphic image at the specified location on the screen, at its original pixel size.

Overlay dimensions (for reference only): When positioning the graphic and setting some of the parameters, it can be useful to know the native pixel dimensions of the overlay image. You don’t need them for creating an overlay, so they’re there just there for reference. When you open GIF, JPG and BMP images, the pixel dimensions will be entered automatically; for other image types, you can enter those manually after determining them some other ways (like right-clicking on a graphic file and choosing Properties).

Screen Parameters: Sets the “point relative to the screen origin that the overlay image is mapped to”, where the screen origin (x=0, y=0) is in the lower left corner. There are three options for units, set by the dropdown:

  • fraction – The fraction across the image screen where you want the reference point, e.g. 0.5 is halfway across the screen. I’d recommend using the fraction unit option instead of the next two pixel-based options because the overlay will behave better across a wider range of screen resolutions. Can be greater than 1 or negative, but for some screen parameters this can position the overlay out of sight.
  • pixels – The pixel position for the origin measured from the lower left-hand corner of the screen. Can be larger than the screen size, or negative, but this may also position overlay out of sight.
  • insetPixels – Similar to pixels, but measures from the upper-right-hand corner of the screen.

Default value is fraction; if you don’t enter values below the units, the default is the center of the screen.

Overlay Parameters: Similar to Screen Parameters, sets the reference point for the overlay image. Same units (and caveats as above).

For example, if you set the units and parameters for both the screen and overlay to fraction (0.5,0.5), you’ll position the image directly in the middle of the screen for all screen resolutions and sizes. Change the screen to (0,1), and the overlay will be positioned in the upper left corner with only the lower-right-quadrant visible; change overlay to (0,1) as well, and the entire overlay will be visible in that corner.

Draw Order: An integer that sets the draw order if you have multiple overlays; overlays with higher draw order numbers will go on top of ones with lower numbers. For example, an overlay with a draw number of 3 will be drawn on top of an overlay with draw number 1. If this is blank, the default is 0.

The rest tomorrow …

Other free utilities can be found on the Utilities page. If you find this or any of my other utilities particularly useful and would like to show your appreciation, donations of any amount are gratefully accepted via PayPal.
Screen Overlays In Google Earth

Many people are familiar with ground overlays in Google Earth, which drapes a graphic image (like a map) over the terrain in Google Earth. I’d guess that fewer people are familiar with screen overlays, since unlike ground overlays you can’t create and edit them directly in Google Earth, but have to create and edit them in the KML file. A screen overlay is a graphic that’s “embedded” in the viewing screen, so that it doesn’t change as you move around the globe, or change the viewing angle. If I display a screen overlay at one viewing angle and height:

Continue reading ‘Screen Overlays In Google Earth’


World Digital Magnetic Anomaly Map (WDMAM) Released

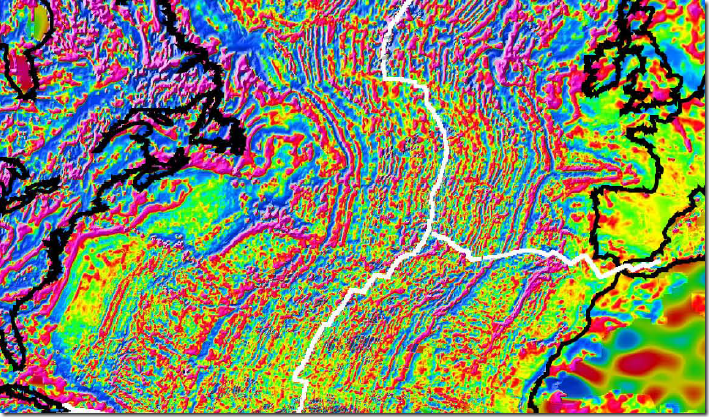
The BBC has an article on the release of the first worldwide map of magnetic anomalies, deviations in the earth’s magnetic field due to effects from magnetized crustal rocks. Nice views of the magnetic striping on either side of the Mid-Atlantic Ridge resulting from ocean-floor spreading (the driver of continental drift) and prehistoric reverses in the direction of the earth’s magnetic field:

magnetic

From the Commission for the Geological Map of the World, which has links to this and other small-scale world geology maps for sale; the BBC article has a link to a free high-resolution PDF map of the magnetic anomaly map.


KML Time Code Utility

Frank at Google Earth Blog links to a new Google article on the nuts-and-bolts of KML time coding, which goes into far greater detail than my own simple post. Not too long ago, I created a simple utility for embedding time data into a KML file after the first feature tag, and which doesn’t require you to fiddle with the KML code. It has the limitation that it only embeds basic time data after the first KML feature tag; if you have multiple feature tags in a KML file, and want to embed separate time data for each of them, my utility won’t help. And if you read the Google article and want to get more creative with time coding, you’ll have to manually write the KML time code yourself and put it into the KML file within the corresponding feature section.

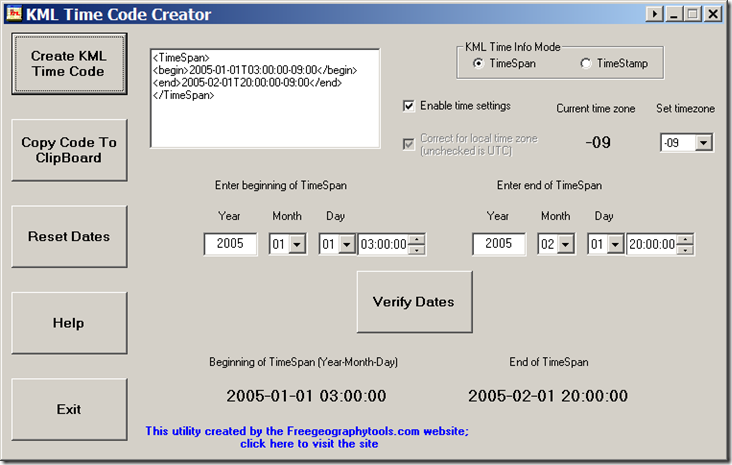
I’ve created a stripped-down version of that KML time utility called “KML Time Code Creator” that lets you set the TimeSpan or TimeStamp with a GUI, and then creates the properly formatted KML time code to copy and paste into your own KML file. Download the executable file here; if you get error message about missing files, download and install the full version of the KML Time Embedder Utility, which installs the required files.

KMLTimeCode

Setting time parameters is done the same as in my KML Time Embedder utility, so I’ll refer you to those posts for details. Once you’ve set and verified the time parameters, click on the “Create KML Time Code” button at upper left, and the KML time code will be generated and displayed in the white text box. You can copy the text in this box to the clipboard with the appropriate button at left, and then paste it into your own KML file. Nothing fancy, but it does the job.

Other free utilities can be found on the Utilities page. If you find this or any of my other utilities particularly useful and would like to show your appreciation, donations of any amount are gratefully accepted via PayPal.


Free Blank/Colored Map Graphics

The “blank map, world map” site (sic) has lots of map graphics in GIF, EPS and PDF formats, under the Creative Commons license so they’re free to use. World and continent maps are available (multiple projections for world maps) blank/uncolored, with and without borders; country maps are available with and without borders and subdivision names.

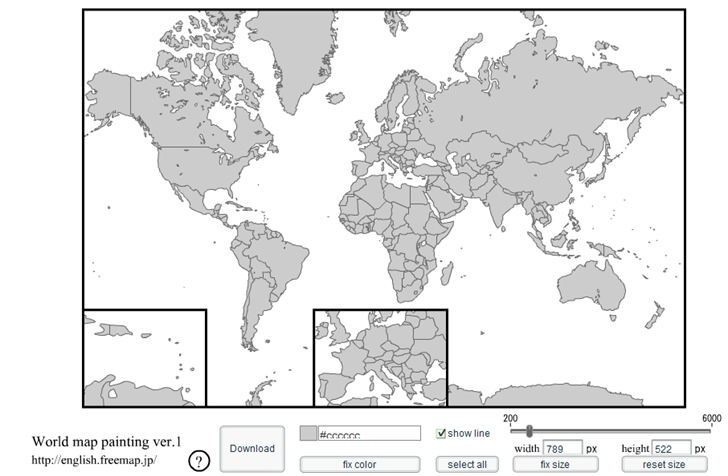
Perhaps the most unique application is an online paintable world map that lets you color in countries with your choice of colors, and then export the graphic file in PNG format in sizes from small (200 x 132 pixels) to large (6000 x 3973):

printableworldmap

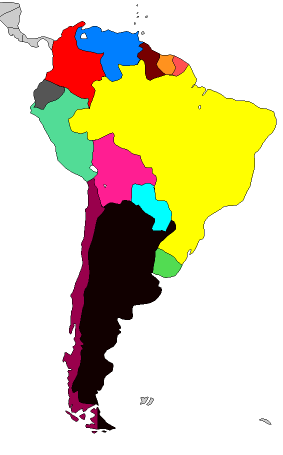
Click on a country or countries to select, then select the color you want to use for them (note: you need to de-select the country or countries you’ve just colored by clicking on them before coloring the next set). Useful for creating wildly-inappropriate coloring schemes:

world_mapa


KML Random Placemark Generator

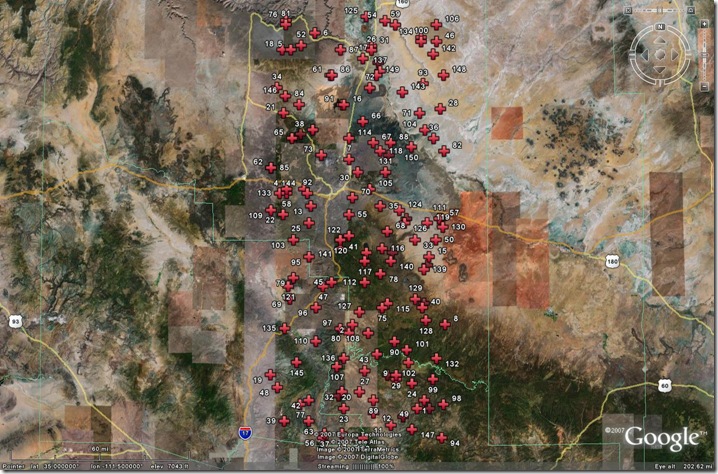
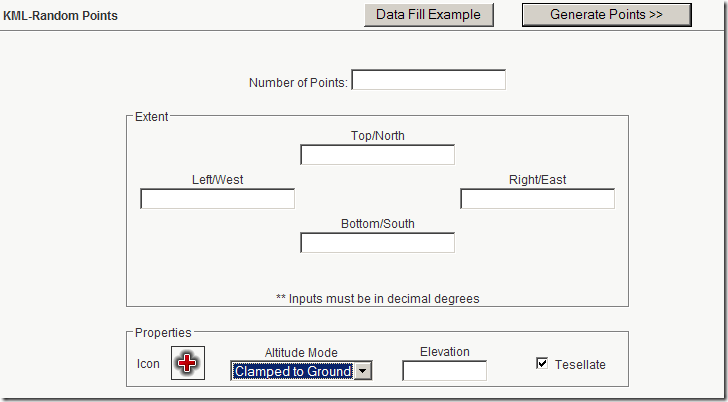
To go along with its new KML grid creator, Zonums Software also has a new web app that generates a randomly-distributed set of placemarks in KML for use in Google Earth and other compatible apps. Enter latitude/longitude limits for the area along with the number of points and other parameters in the web form:

randomKMLform

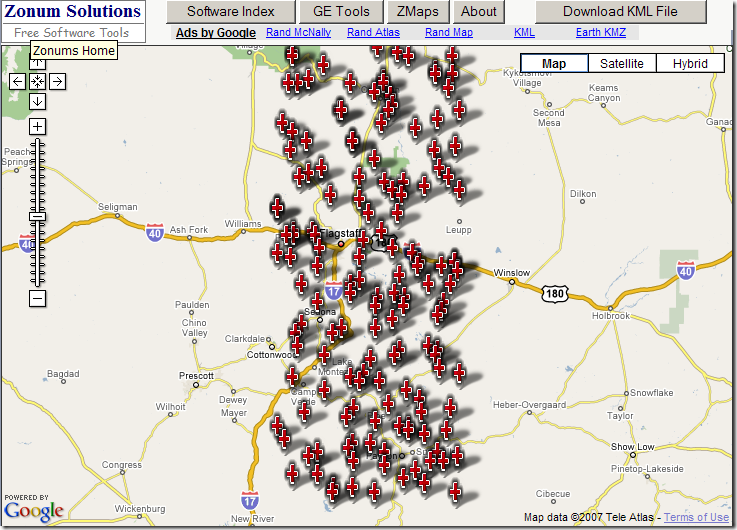
Click on “Generate Points”, and get a Google Maps view of the random points:

randomGoogleMaps PM

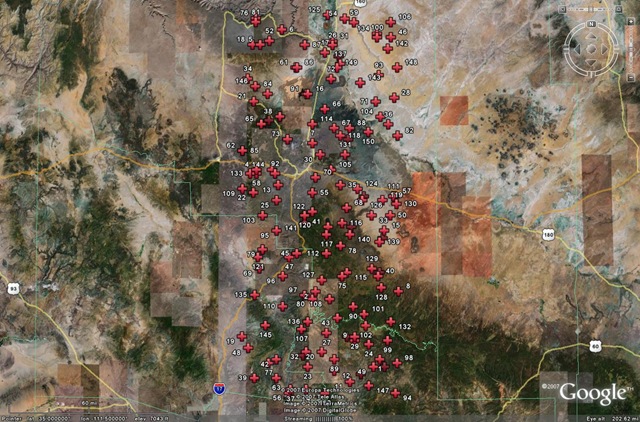
Click on “Download KML File”, and the KML code is generated and displayed in the browser. Save the page as a KML file, and you can open it in Google Earth:

randompointsGE

Randomly-distributed points are often used for statistical sampling purposes. While KML may not be the ideal format for that application, this is at least a convenient way to generate them. If you need them in a more conventional GIS format (like a shapefile), you can use Zonum’s kml2shp application to convert the random KML points into a random point shapefile.


MGRS/UTM/Latitude-Longitude Converter

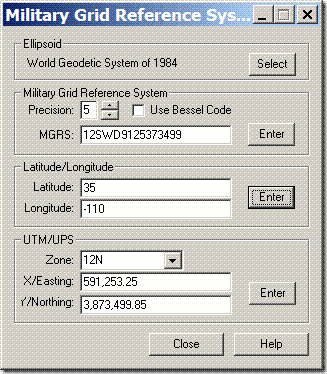
For converting to and from the Military Grid Reference System (MGRS) and UTM/LatLong, the MGRS Conversion Utility from Mentor Software is a small utility (365kB download) which does only that. During installation, everything stops for a long while, but it’s not a crash – it will eventually complete the installation process. Once installed and run, just enter one of three kinds of coordinates, UTM, latitude/longitude, or MGRS, click Enter next to the entered coordinates, and they will be converted to the other two coordinate systems:

mgrs

You can choose from 61 different datums in the “Ellipsoid” section at top. Latitude/longitude can be entered in decimal degrees, or as degree-minute-second with each set of numbers separated by a space. Set the MGRS precision with the up/down arrows; check “Use Bessel Code” for those areas where it’s appropriate for MGRS (mainly Europe – see the help file for more info).

And if you’re interested in displaying MGRS coordinate data in Google Earth, the Nearby.org.uk website has a link that plots MGRS gridlines in Google Earth, with a central marker that displays the 1-meter MGRS reference.

Addendum: See this post for a roundup of MGRS utilities.


Google Earth PhotoOverlay Tool

Brand-spanking new from the UCL Centre for Advanced Spatial Analysis (CASA) comes the Google Earth Photo Overlay Creator, a free program to aid in creating PhotoOverlays, photographic images you can embed into Google Earth to correspond to the actual view. While you can do this to a limited degree from Google Earth, and can also do it directly in KML, the GE Photo Overlay Creator simplifies the job tremendously. It also lets you “tile” a large image, similar to tiled Ground Overlays, so that it loads in only the image information necessary for that particular view. This reduces both the bandwidth and computational requirements, particularly for large images.

The program is Java, and will run in Windows, Macintosh and Linux (check the readme.txt file for info; see this Digital Urban post for a full instructional tutorial). Full support of all image formats requires that you have Java Advanced Imaging installed.

Via Digital Urban blog.

Added 11/6/07: The Google Earth Blog links to another tutorial on this tool at GELessons.