blankblank blank


Author Archive for Leszek Pawlowicz Page 41 of 79


Grid Creation And Path/Polygon Measurements: Two New Online KML Tools

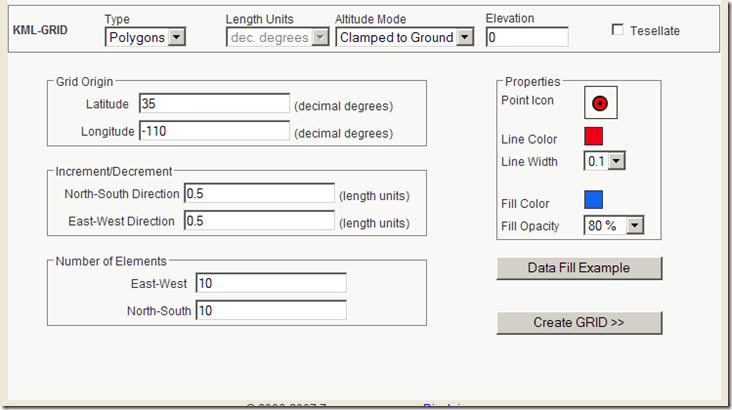
KML-GRID: Creates a point, line or filled polygon grid in KML. Set the desired parameters:
KMLGrid1

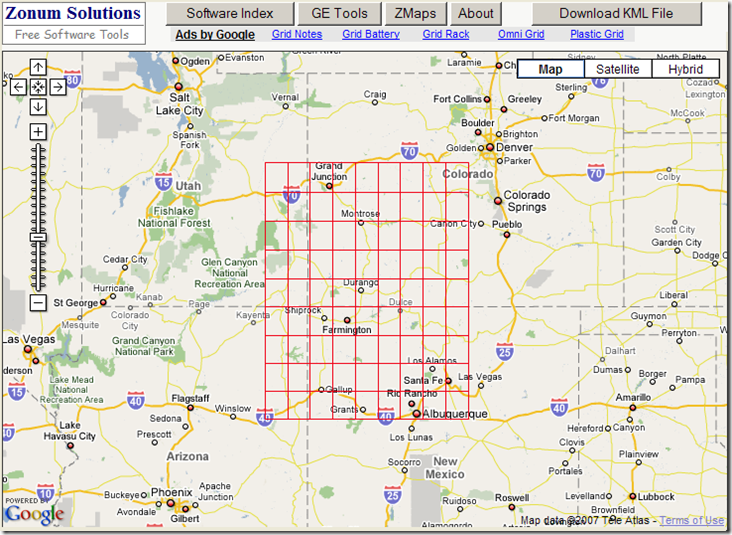
Clicking on “Data Fill Example” enters sample data into the boxes. For Grid Origin, it’s decimal latitude/longitude. For Increment/Decrement, it’s currently also decimal degrees, as the “Length Units” drop-down at top is currently limited to those units (wouldn’t surprise me if additional unit options were added soon). Click on “Create GRID”, and a view of the grid is shown in Google Maps (lines in this case):
10-24-2007-2.20.39 PM

Click on the “Download KML File” button, and the KML code will appear in your browser; either choose “Save As” from the File menu, or copy and paste it into a text editor and save it as a KML file there. Open it in Google Earth, and there’s your grid:
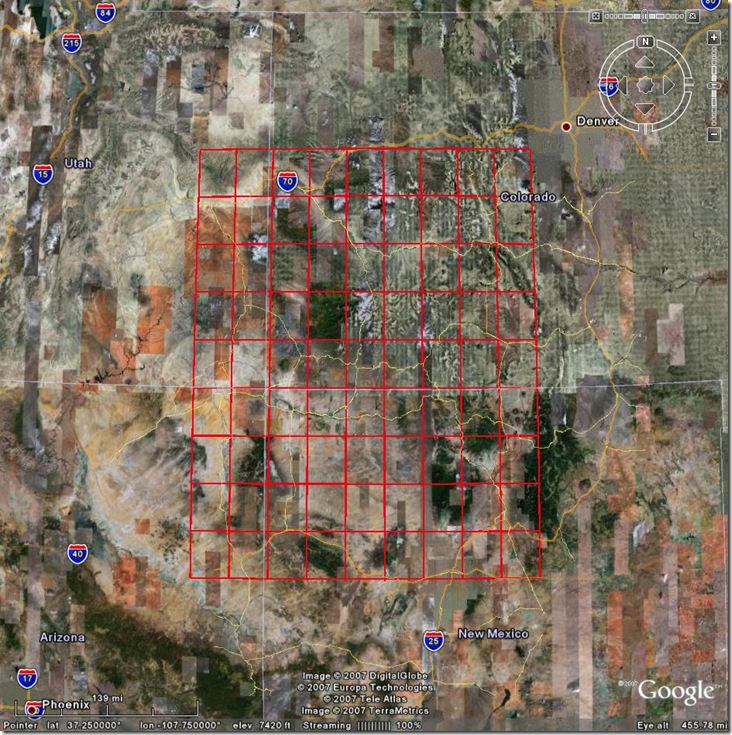
kmlgrid

A useful complement to GE-Path for creating KML grids.
KML – Area & Length: I’ve covered some other utilities that will calculate path lengths from KML code, filling in a gap in Google Earth. This new utility calculates not just path lengths, but areas as well. Paste the KML code into the text box:
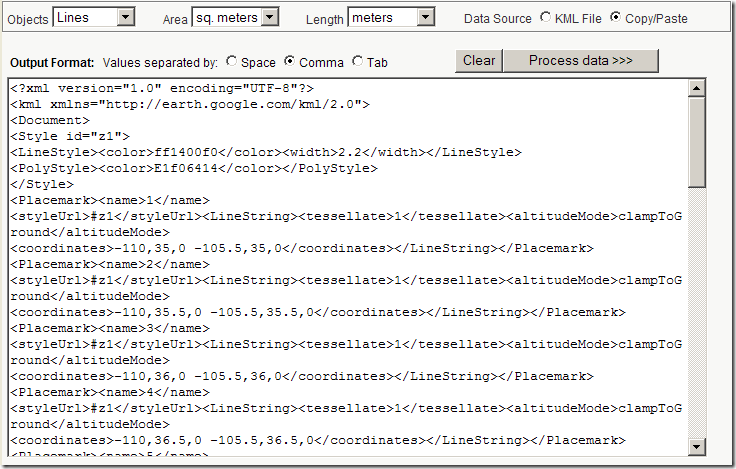
kmllengtharea

For KML files that have both paths and polygons, you can calculate just the path lengths, just the areas, or both; set the units and the delimiters at top. When you click on “Process data”, you’ll get back a text window with the IDs and lengths/areas of the features in the KML file, separated on each line by the chosen delimiter. e.g. for the grid file above:
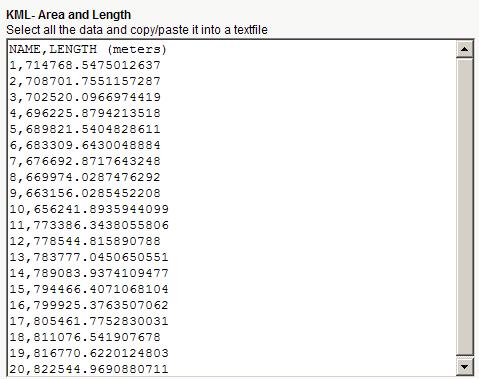
kmllengthresults


KML Time Embedder Improved With Hour-Minute-Second Ability

I posted a while back about a small utility I wrote called KML Time Embedder, which lets you embed TimeSpan or TimeStamp data into a KML file for use in Google Earth time animations. That version only allowed year-month-day times, but I said that if enough people asked, I’d add the ability to stamp with hour-minute-second in addition to year-month-day. Thanks to popular demand (two people), I’ve modified the program to include that capability.

If you haven’t already read posts one and two on this utility, the following won’t make much sense.

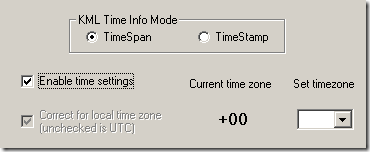
In the upper-right, above the checkbox to enable timezones, is a new one to enable setting the time of day for each date:

enabletimeset

Check that box, and setting the timezone is automatically enabled (and can’t be turned off). Set your local time zone relative to UTC (Greenwich Mean Time) using the dropdown at right.

With that box checked, timeset boxes will appear to the right of the date set inputs:

timeinputs

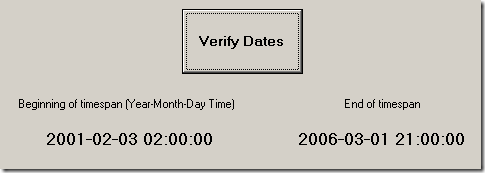
These will only become enabled for input after you’ve selected a day, and are set for 24-hour time (e.g. 2:17 PM is 14:17:00). As before, if you’re in TimeSpan mode and want it to run from the beginning time to the present, just leave the end of the timespan section blank. Click on Verify Dates to make sure they’re what you want. The program does check to see if the dates and times are valid, but I’m not 100% sure I’ve made that foolproof, so you should check them manually:

sampledatetime

If they’re what you want, click on the “Embed Time Information” button, and the output file will be written with both date and hour of day information.

If you’ve already downloaded and installed the KML Time Embedder, you can just download this small executable file (about 20 KB) and unzip it into the program directory. For that matter, the executable by itself should work fine for most people. If it doesn’t, you can download the full install program (2 MB) which now contains the updated executable.

Other free utilities can be found on the Utilities page. If you find this or any of my other utilities particularly useful and would like to show your appreciation, donations of any amount are gratefully accepted via PayPal.


One More Color Design Resource

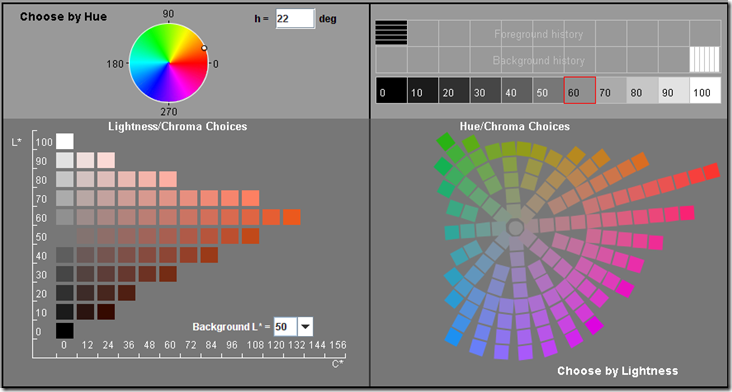
In comments on a previous post, Igor Asselbergs points to a page on Using Color In Information Graphics from the NASA/Ames Color Research Lab. In addition to a very large collection of articles/tutorials on effective (and ineffective) uses of color in representing information graphically, there’s also a Java-based Color Tool:

Color_Tool

“The Color Tool is designed to provide the designer with views of the perceptual relationships among the possible color choices. It improves on previous tools by more clearly representing the constraints imposed by the physical display and the structure of human color vision. This should help the designer manage the luminance contrasts of symbol and background colors by showing the tradeoffs in hue and saturation.” – from the website. One nice feature is the ability to change the background luminosity, and see how that affects the perception of the various colors.

Thanks, Igor!


Putting Together A Basic Linux GIS Workstation

For those who want to experiment with Linux-based GIS, or you have older hardware that just can’t handle Windows XP, Matt Perry has a nice post on his blog on adding applications to a basic Ubuntu 7.10 Linux installation to turn it into a decent open source GIS workstation. Step-by-step directions are included for installing:

  • Quantum GIS
  • GRASS
  • MapServer
  • GPSBabel
  • GMT (Generic Mapping Tools)
  • PostGIS
  • … and more

You’ll find the apps installed in the /usr/bin directory.

A few more Linux-compatible software packages to consider adding to this set (require Java to be installed on the system):

uDig extracts into a folder that contains the Java program launcher. To install a *.bin file in Ubuntu Linux (like gvSIG), open the Terminal application, change the directory to the location of the *.bin file, and type:

sudo sh *.bin

Where *.bin is the full name of the .bin file.

If you want to augment these application, there’s a fair number of Windows geographic tools (e.g. MicroDEM) that will run under the WINE emulator.

Taking this as another opportunity to give Ubuntu Linux a spin, I will say that Ubuntu 7.10 (“Gutsy Gibbon”) is another step forward for desktop Linux, but I still have major ease-of-use issues with it. I find myself pounding my head against a wall far more often with Linux than with either Windows XP or Macintosh (but don’t get me started on Vista).


Additional Color Applications For Maps And Design

Here’s a few additional color applications that might prove a useful complement to the application Kuler (from yesterday’s post) in designing map color schemes.

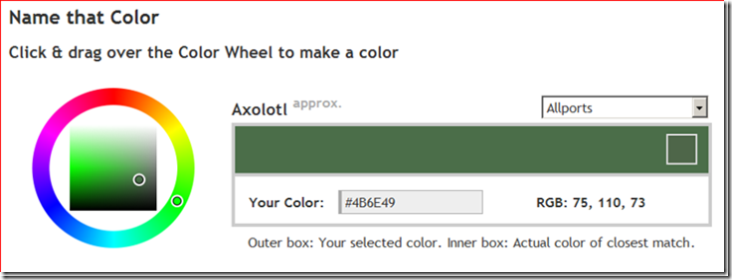
An online color application: Name That Color. Select a color from the color wheel, and Name That Color will … name that color. Also gives you the RGB and hex numbers for it.

snapper1188961707734_thumb1

Open source; Javascript and php code available at the website.

Via Download Squad.

Color Cop: A Window desktop application that lets you:

  • Determine the color code for a color anywhere on your desktop
  • Single-pixel sampling, or 3×3 and 5×5 averaging
  • Automatically generates a 42-color palette of complementary colors for your select color
  • And more …

Via Lifehacker.

Colorzilla: A Firefox extension that shows the color codes (RBG and hex) for the point under the cursor in the Firefox browser.

Via Lifehacker.

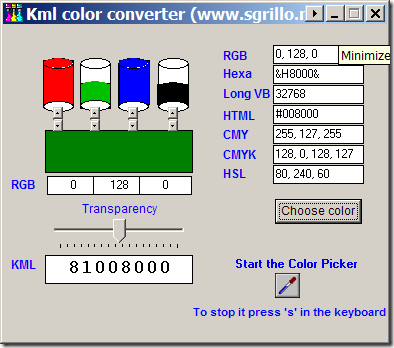
KML Color Converter: Mix and match R, G, B and black, set transparency, and get back the KML color code; gives other color codes as well (like RGB, CMY, CMYK, HSL). Also has a color picker to select colors from anywhere on-screen.

10-4-2007-9.38.32 PM


Color Palette Generator, Color Hunter: Online apps that create a color palette based on those found in a graphic or image file. You enter the URL of the image, and get back a palette with the colors in that image.


Creating Map Color Schemes With Kuler And ColorBrewer

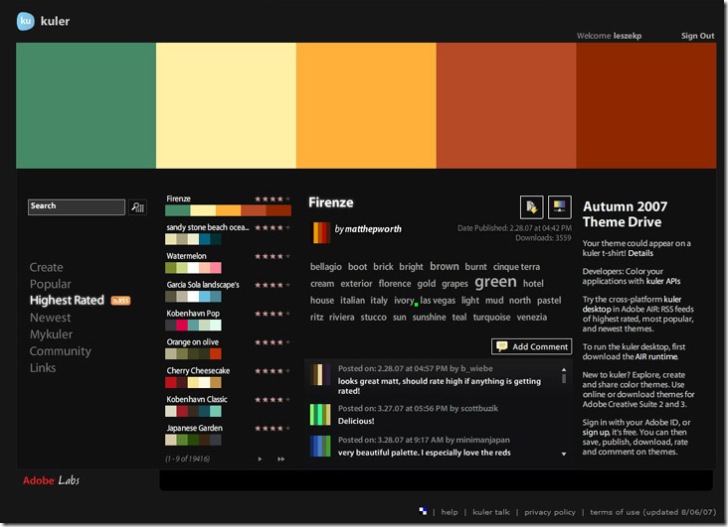
A while back, I posted about ColorBrewer, an online map-oriented tool for experimenting with different map coloring schemes. It’s a great tool, but with a limited number of color palettes to choose from, and no capability to modify them or create your own. Kuler is an online color palette creator from Adobe (Flash, multi-platform; free registration required) that lets you create and view your own color palette, or browse and modify palettes created by others. There’s a ranking system that lets you give a rating (1-5 stars) for palettes, and you can browse by popular (most downloads) or highest star ratings.

kuler

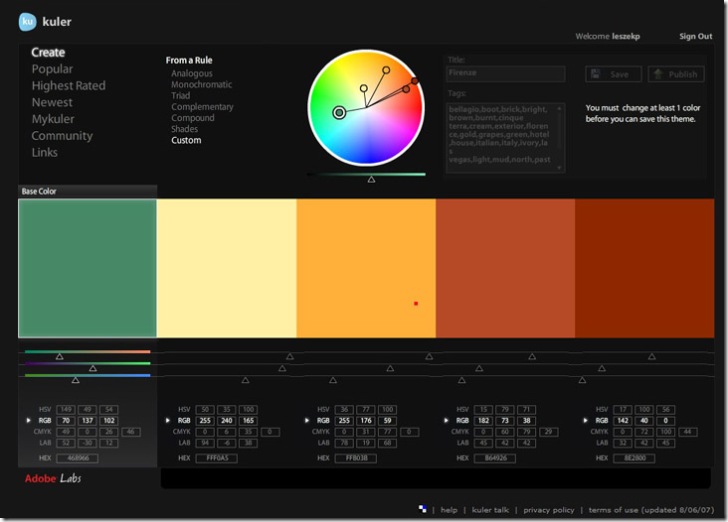
If your graphics application supports Adobe Swatch Exchange files (*.ase), you can download a swatch file from the application. If not, you’ll have to write down the color specs down (HSV, CMYK, RGB, LAB or HEX) from the settings in the Create window for your new palette. For an existing palette, click on the “Make changes …” button at middle right:

Kuler screenshot

If you want to enter ColorBrewer palettes into Kuler for experimentation and modification, you can download an Excel file with RGB values from the ColorBrewer updates page.


Beta Version Of DNRGarmin

One of the first posts on this blog was about the 5.1.1 stable version of DNRGarmin. Long story short, if you work with GIS and you use Garmin units for your data acquisition, this program is a must-have. It can upload/download data in text, DBF and shapefile formats to/from Garmin GPS units, and also comes with an extension for direct interfacing with ArcGIS software. Version 5.1.1 had some utility for non-Garmin GPS units and applications, but version 5.2, currently in beta, has some new features that make it a worthwhile installation for anyone with a GPS.

DNRGarmin has actually been in beta for a while, and I’d been waiting to see if it would come out of beta; the date on the last release is 5/18/07. The webpage indicates in big bold letters that in the beta, “THE ERROR RELATED TO USB CONNECTIVITY AND LOGIN RIGHTS HAS NOT YET BEEN RESOLVED“. But I’ve installed it successfully on 3 different computers without encountering this problem, so there’s a decent chance it should work on yours as well.

New features in version 5.2 include:

  • Load data in KML and GPX (in addition to the previous options of text, DBF and shapefile formats)
  • Load data directly from the “My Place” pane in Google Earth
  • Save data in KML and GPX (along with the previous options of projected/unprojected shapefiles, text and DBF)
  • Convert between the different formats
  • Collects waypoint time data from supported units

Note: The new version’s ArcGIS extension no longer works with ArcGIS 8.x, only 9.x. If that’s important to you, you should stick with version 8.1.1, still available on the web page. But the new version works fine in stand-alone mode.


Maps Of War

The Maps Of War site has animated embeddable Flash maps illustrating historical trends, like this one showing the history of the Middle East over the past 5000 years:

And the Library page has a growing collection of links to other animated history maps from across the web.

Via BoingBoing.