blankblank blank


Archive Page 11 of 106


Displaying GPS Data On A Website

Got an email a few weeks ago from someone who wanted to post data taken with a GPS, in GPX file format, and display it as an embeddable map on his blog; he couldn’t find anything on that on the web. I offered one possibility, and he in turn suggested that I might put up a brief post on the topic. Here’s a few ways to do it, off the top of my head.

Some of these will require you to convert your GPX data into an alternate format, like KML or shapefile. A search of this website will bring up lots of programs that can do these conversions, but probably the simplest way is to load your GPX file into Google Earth, then export the data in KML or KMZ format. Note: All of these sites require you to create a free account.

Google Maps My Maps – The alternative I suggested; not a lot of features, but very easy to use. Import KML/KMZ files from your computer or a web link, use the built-in editor to add additional features. You can then display the map on your website using a widget.

Google Docs Spreadsheet – If you convert your GPX files to CSV files using a program like DNRGarmin or GPXToPOI, you can import the data into a Google Docs spreadsheet; Google offers a tutorial on converting that data into a KML network link for display in Google Maps or the Google Earth plugin.

GeoCommons – Just posted about this yesterday; upload your data and display it in widget format. All data you upload will be available for anyone to use or download.

MapChannels – Lots of map creation features, and embeddable maps.

ScribbleMaps Pro – Similar to Google Maps My Maps, but offers lots more import options and drawing tools. Highly recommended.

Feel free to add your own recommendations in the comments section.


GeoCommons Relaunches

Been meaning to post about GeoCommons for quite a while now, and while I’d like to take credit for knowing that they had a major site reconstruction in order, it’s more like I just hadn’t gotten around to it yet. GeoCommons lets you upload and map data in a number of formats:

  • Shapefile
  • KML (upload or web link)
  • Comma-separated variable CSV
  • GeoRSS (upload or web link)
  • RSS / ATOM (web link)

The “Commons” part comes because any data you upload is freely available to anyone else, so this isn’t a site for those who want to keep their data private or control it. Once uploaded, you can plot it in a variety of styles (with help from a Color Brewer color picker), against any number of available backgrounds:

  • Road:OpenStreetMap, Google, Bing, Yahoo, World Bank, MapQuest
  • Aerial: Google, Bing, Yahoo, NASA Blue Marble
  • Hybrid (roads and aerial): Google, Bing, Yahoo
  • Terrain: Google
  • Or a solid background color

Multiple layers can be plotted if desired. Once completed, you can send people to a permanent link at the GeoCommons page to view it, or embed it into a website (like below; feel free to scroll and zoom):


View full map

You can also view the data in 3D using the Google Earth browser plug-in.

I found the map creation process incredibly easy, but the data upload process needs some work. It took me five tries to get this fairly small Arizona faults shapefile uploaded; hopefully these bugs will be ironed out soon. This shapefile data was in geographic coordinates, WGS84; if you have shapefile data in any other coordinate system, you’ll need to upload  a .prj file with it; and if you don’t upload the .shx and .dbf files with your .shp file, it will ask for them. All other data formats have to be in latitude/longitude, WGS84 datum. And it will ask you for a substantial amount of metadata to be associated with the actual data files, although much of that isn’t mandatory.

Any data uploaded to GeoCommons can also be exported in shapefile, KML and CSV formats (Beta ATOM, JSON and Spatialite format export available). The recent release has also added address geocoding, time animation, and “GeoJoining” (connecting names with common datasets). A paid version of the service called GeoIQ offers a bigger feature set, including advanced analytical tools.


Demographic Maps With DataPlace

DataPlace lets you plot one or more demographic factors in a Google Maps interface, and create an embeddable web page widget:


Data includes social/ethnic/economic/population/health/etc., and can be plotted at any detail level from census tract all the way up to national; plot multiple parameters on one map, or display two maps side by side with different parameters. Charts, rankings and metrics, too, all embeddable on any website in widget form (like above).

Be warned, though – site is labeled as “Beta” for good reason. Even with a decent help section, figuring out how to do anything is a real chore. And if you’re impatient, avoid this site – it can take several seconds for data selections or map/chart displays to refresh. Very much a work in progress, but there’s good stuff if you’re willing to slog through the difficulties.

Via Free GIS Data blog.


Two Google Earth Views In One Browser Window With Another Earth

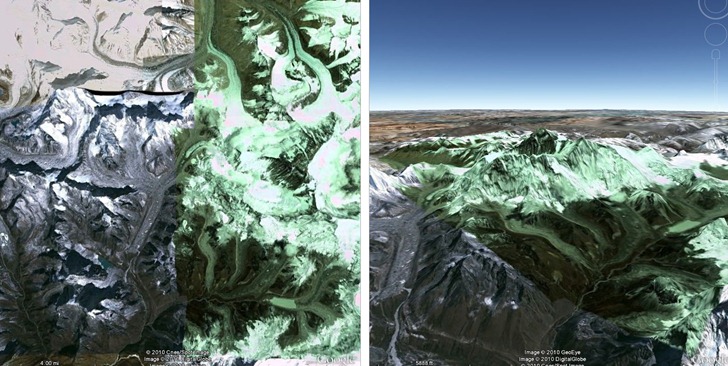
Another Earth puts two Google Earth plugin windows into a single browser view, and lets you control the view in each either independently, or synchronized with each other. So you could have one view from the top, and a second from an angle, like Mt. Everest:

everestcomparison

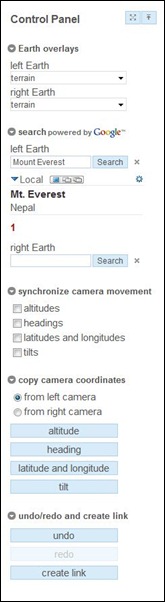
A control panel lets you synchronize/copy parameters like location/heading/tilt/altitude from one view to the other, choose which overlay layers to display, and create a shareable link for a particular view comparison you’ve created:

ae_controlpanel

Tip: Turn on the “terrain” overlay right away for both views; default is off, so that the Earth is flat.

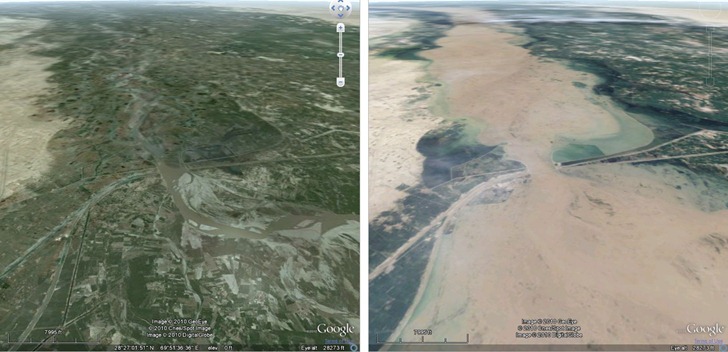
This is a great tool as-is for comparing different geographic features. It will become really awesome when, as the site creator indicates will happen in the future, you can use “historical imagery” as a layer; you’ll then be able to compare location views at different times directly. He’s got a sample subsite already up comparing imagery taken during the recent enormous flooding in Pakistan, compared to pre-flood imagery. I heard the floods were huge, but it wasn’t until I saw this comparison that I started to really comprehend how huge they were:

pakistan


Embed A QR Position Code Losslessly Into A Geotagged Picture With QRStamper

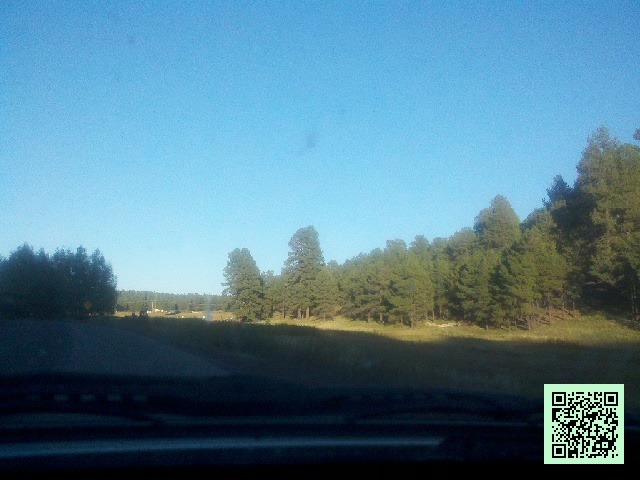
Mike Lee’s QRStamper program will losslessly embed a QR code with the coordinate data for a geotagged photo into a copy of the photo. Just drag and drop the photo onto the program icon, and in the same directory as the original, QRStamper will create a copy of the photo with the QR code embedded at lower right:

2010-09-26_17-33-27_591-QR

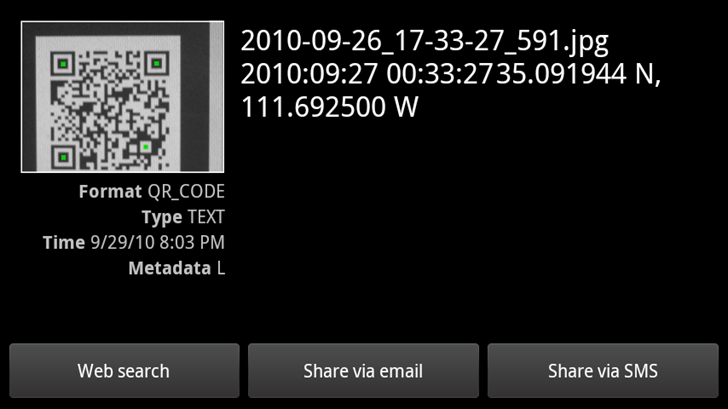
Scan the QR code with an app like Android’s Barcode Scanner, and retrieve the geotagging coordinates:

qr_capture

The similar GeoStamper program embeds a standard geotagging icon losslessly into a photo copy, to indicate it’s geotagged:

untitled-1-geo

His GPStamper program, covered here a long time ago, which losslessly embedded actual coordinate/location data into a photo, is no longer free. However,  it still has a 30-day free trial, and “non-commercial scientific research or survey use is eligible for a free licensed version.”


Compare Geographic Areas With “How Big Really”

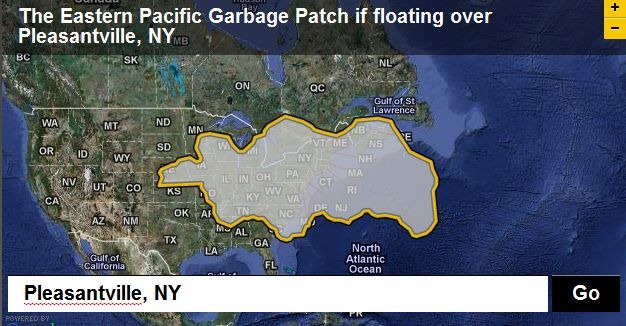
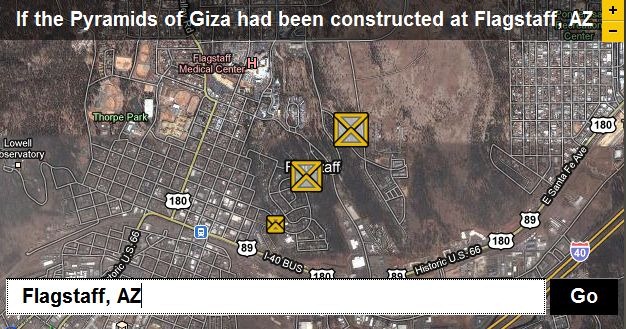
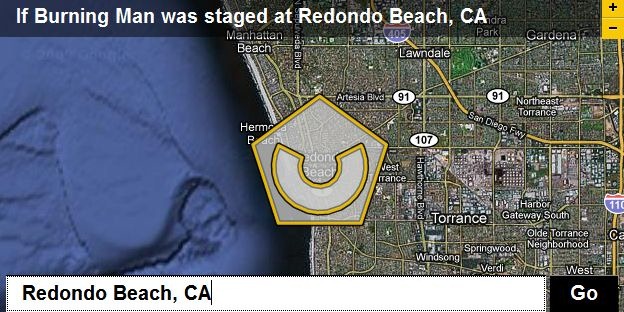
The previously-covered “Move Outlines” site let you trace a border around a geographical feature, then compare that border size with any other area in the world. The BBC’s Dimensions website (aka How Big Really) is a nice companion site; while it doesn’t let you draw your own border, it has pre-drawn areas covering a number of different topics, like Environmental Disasters:

garbagepatch

Ancient Worlds…

pyramids

Festivals and Spectacles …

burningman

… plus Space, Depth, The War on Terror, The Industrial Age, Battle Of Britain, and Cities In History. Great for getting a sense of scale.

Via Digital Geography.


Online Map Check And Area Calculator

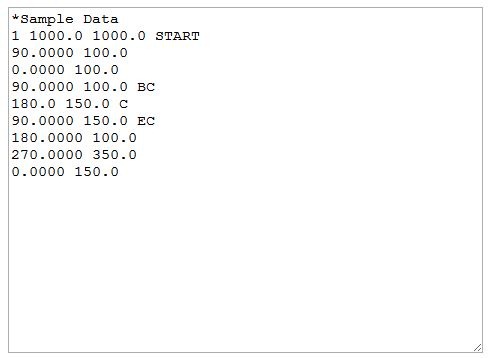
Here’s a unique free web app from Underhill Geomatics Limited. The Online Map Check And Area Calculator lets you enter bearings and distances, say for the boundaries of a parcel/plot, check on their closure, plot the parcel/plot and calculate the area enclosed. Enter a starting coordinate, and get coordinates for every point entered by distance/bearing. Circular curves are supported by entering the center point of the curve and radius of curvature. Full instructions included on the main site page, and a sample dataset is preloaded into the data entry box:

sampledata

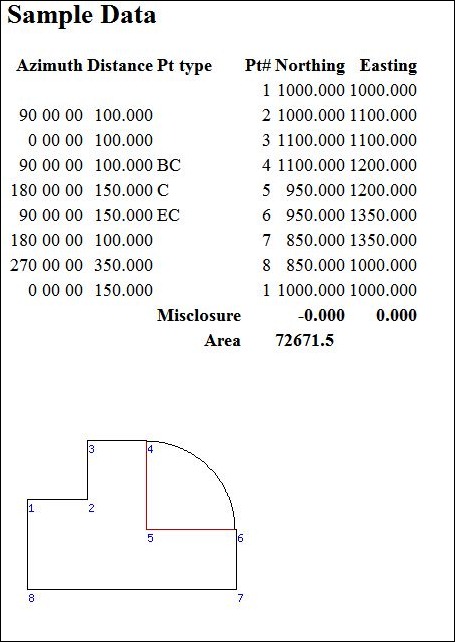
Press Calculate, and get the results:

sampleresults

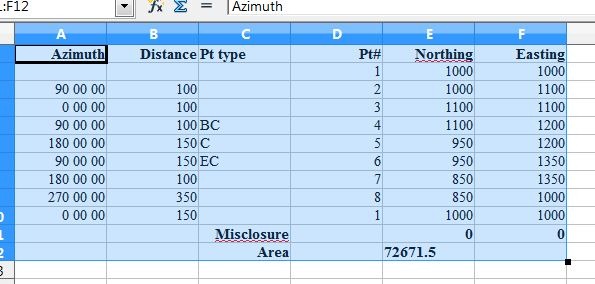
Select and copy the data from the web page, and you can paste it into the desktop app of your choice, say a spreadsheet:

tabdata


The Big List Of GeoStatistical / GeoSpatial Analysis Software III – R to Z

Descriptions come from the software’s website or documentation. I’ll probably put biologically-oriented software in a separate series. Click on the program title to go to its website.

R … free software environment for statistical computing and graphics

Some links for geographically-related R resources and software:

GeoDa link page for geo-R resources

CRAN page – source for stat module binaries

CRAN page on spatial analysis modules for R – Good place to start looking for specific modules.

_____________________________________________________________________________________________________

Regional Crime Analysis Geographic Information System (RCAGIS)

The US Department of Justice Criminal Division GIS Staff, in conjunction with the Baltimore county Police department and the RCAS group, has developed a crime analysis system called RCAGIS (Regional Crime Analysis GIS). RCAGIS is an ESRI MapObjects® based system that is designed to facilitate the analysis of crime on a regional basis. RCAGIS also integrates the CrimeStat® spatial statistics software package developed by Ned Levine and Associates under a grant from the National Institute of Justice. The RCAGIS Crime Analysis System was designed specifically to assist in the analysis of crime incident data across jurisdictional boundaries.

Note: Requires ESRI MapObjects to be installed, and no longer under development.

Repast Simphony

Repast Simphony is a free and open source agent-based modeling toolkit that simplifies model creation and use … including 2D and 3D Geographical Information Systems (GIS) support

SANET: Spatial Analysis On Networks

SANET is a toolbox for analyzing events that occur on networks or alongside networks e.g., car crashes on roads and beauty parlors in downtown streets, respectively. Networks may be roads, rivers, pipe-lines, cables, etc. The user is supposed to use SANET for academic and educational purposes only.

ArcGIS extension only.

SaTScan

SaTScan™ is a free software that analyzes spatial, temporal and space-time data using the spatial, temporal, or space-time scan statistics. It is designed for any of the following interrelated purposes:

  • Perform geographical surveillance of disease, to detect spatial or space-time disease clusters, and to see if they are statistically significant.
  • Test whether a disease is randomly distributed over space, over time or over space and time.
  • Evaluate the statistical significance of disease cluster alarms.
  • Perform repeated time-periodic disease surveillance for early detection of disease outbreaks.

The software may also be used for similar problems in other fields such as archaeology, astronomy, botany, criminology, ecology, economics, engineering, forestry, genetics, geography, geology, history, neurology or zoology.

SGeMS

The Stanford Geostatistical Modeling Software (SGeMS) is an open-source computer package for solving problems involving spatially related variables. It provides geostatistics practitioners with a user-friendly interface, an interactive 3-D visualization, and a wide selection of algorithms.

Space-Time Analysis of Regional Systems (STARS)

Space-Time Analysis of Regional Systems (STARS) is an open source package designed for the analysis of areal data measured over time. STARS brings together a number of recently developed methods of space-time analysis into a user-friendly graphical environment offering an array of dynamically linked graphical views. It is intended to be used as an exploratory data analysis tool. STARS can also be used from the command line to support more flexible and specialized types of analyses by advanced users. As such STARS should appeal to a wide array of users. Written entirely in Python, STARS is crossplatform and easy to install (and expand).

Note: Alternate homepage link is given on the main page, but it leads to a page informing you that you don’t have Java 1.4.2 installed. Status of this program is unclear.

Spatial Analysis and Decision Assistance (SADA)

Spatial Analysis and Decision Assistance (SADA) is free software that incorporates tools from environmental assessment fields into an effective problem solving environment. These tools include integrated modules for visualization, geospatial analysis, statistical analysis, human health risk assessment, ecological risk assessment, cost/benefit analysis, sampling design, and decision analysis

Spatial Analysis Utilities

S.A.U. was developed for archaeological intersite studies. However archaeology is not the only discipline that study point distribution maps. This tool will help everybody that has to deal with point pattern analysis.

STEM: The Spatiotemporal Epidemiological Modeler Project

The Spatiotemporal Epidemiological Modeler (STEM) tool is designed to help scientists and public health officials create and use spatial and temporal models of emerging infectious diseases. These models can aid in understanding and potentially preventing the spread of such diseases.

VESPER: VARIOGRAM ESTIMATION AND SPATIAL PREDICTION PLUS ERROR

VESPER is a PC-Windows program developed by the Australian Centre for Precision Agriculture (ACPA) for spatial prediction that is capable of performing kriging with local variograms (Haas, 1990). Kriging with local variograms involves searching for the closest neighbourhood for each prediction site, estimating the variogram from the neighbourhood, fitting a variogram model to the data and predicting the value and its uncertainty. The local variogram is modelled in the program by fitting a variogram model automatically through the nonlinear least-squares method. Several variogram models are available, namely spherical, exponential, Gaussian and linear with sill. Punctual and block kriging is available as interpolation options. This program adapts itself spatially in the presence of distinct differences in local structure over the whole field.

Note: Nudgeware; doesn’t seem to be under development anymore.

WinBASP

The Bonn Archaeological Software Package (BASP) is a non-profit software project for and by archaeologists which has been developed cooperatively since 1973. It now includes more than 70 functions for seriation, clustering, correspondance analysis, and mapping tools for archaeologists working with IBM compatible PC’s under DOS and all versions of Windows.

No longer supported or maintained; authors suggest PAST as an alternative.