blankblank blank


Archive Page 12 of 106


The Big List Of Geostatistical / Geospatial Analysis Software II – G to Q

Continued from Part I (A-F) yesterday. Descriptions come from the software’s website or documentation. I’ll probably put biologically-oriented software in a separate series. Click on the program title to go to its website.

GAM: Cluster hunting software

The Geographical Analysis Machine (GAM) is an attempt at automated exploratory spatial data analysis of point or small area data that is easy to understand. The purpose is to answer a simple practical question; where are clusters in geographical data? Please note it is an exploratory analysis and does not prove existence – clusters may, for example, be down to pockets of poor data or, very unusually, be due to just the random scattering of occurrences.

GeoBUGS

GeoBUGS has been developed by a team at the Department of Epidemiology and Public Health of Imperial College at St Mary’s Hospital London. It is an add-on to WinBUGS that fits spatial models and produces a range of maps as output.

GeoDA

Luc Anselin’s group at Arizona State University; hosts a number of geospatial analysis programs and web apps, including

  • Several versions of GeoDA (old Windows version, and newer multi-platform version (GeoDaSpace and GeoDaNet).
  • PySAL, a cross-platform library of spatial analysis functions written in Python.
  • A Web-Based Tool for Spatial Data Analysis (incl. weights conversion & transformation, spatial lag, smoothing, LISAs)
  • Java tools for spatial analysis: EB & SR smoothing, excess risk maps, global Moran scatterplot and spatial reference distribution

And more, including lots of documentation and links.

GeoVISTA Studio

GeoVISTA Studio is an open software development environment designed for geospatial data.Studio is a programming-free environment that allows users to quickly build applications for geocomputation and geographic visualization.

GRNN_2 –  General Regression Neural Networks

GRNN are a class of neural networks widely used for the continuous function mapping. They are based on a well known nonparametric (kernel) statistical estimators. An important advantage of the GRNN is that training is very fast.

GSLIB

GSLIB is an acronym for Geostatistical Software LIBrary. This name was originally used for a collection of geostatistical programs developed at Stanford University over the last 15 years.

GUIDOS

The software GUIDOS (Graphical User Interface for the Description of image Objects and their Shapes) can be used to perform a Morphological Spatial Pattern Analysis (MSPA) on raster image data.  MSPA conducts a segmentation of the image foreground data into mutual exclusive feature classes.

MicroCity

A spatial modeling framework for scientific analyses. Additional to fundamental GIS functions, many unique libraries such as Network, Fractal, 3D, Simulatoin and LP Solver have also been supported as built-in functions to facilitate scientific modeling.

PAST: PAleontological STatistics

PAST is a free, easy-to-use data analysis package originally aimed at paleontology but now also popular in many other fields. It includes common statistical, plotting and modelling functions.

Pattern Analysis, Spatial Statistics, and Geographic Exegesis (PASSAGE)

PASSaGE is a free, integrated, easy-to-use software package for performing spatial analysis and statistics on biological and other data.

The Big List Of Geostatistical / Geospatial Analysis Software I – A to F

Now, a series of posts listing a large number of free programs / services for doing geostatistical / geospatial analysis. Programs included will be those that specialize in this area; other general purpose GIS apps with statistical functionality (e.g. SAGA, MicroDEM, gvSIG) won’t be included.  Descriptions come from the software’s website or documentation; this has the advantage of concealing my vast ignorance in this subject area. I’ll probably put biologically-oriented software in a separate series. Click on the program title to go to its website.

BayesX

BayesX is a software tool for estimating structured additive regression models…BayesX is able to manipulate and draw geographical maps. The regions of the map may be colored according to some numerical characteristics.

CrimeStat III

CrimeStat III is a spatial statistics program for the analysis of crime incident locations.

CSPro: Census And Survey Processing System

CSPro (Census and Survey Processing System) is a public-domain software package for entering, editing, tabulating and mapping census and survey data.

_________________________________________________________________________________________________

Cyze And Associates Software

GeoSpatial Explorer

Geospatial Explorer has been written to enable geologists, environmental scientists, and engineers to apply innovative science and technology to enhance and expedite the reduction of risk to human health and the environment. Geospatial Explorer permits the user to identify, understand, and solve complex environmental problems better, faster, and cheaper.

GeoStatistics Package

As part of Cyze & Associates’ support for Geostatistical Analysis, Cyze & Associates provides a free Geostatistics package that compliments Geospatial Explorer by providing an interface to the SAGE 2005 variogram reports and GSLIB 2.0 kriging and simulation executables.

__________________________________________________________________________________________________

Distance Mapping and Analysis Program (DMAP)

DMAP is a Windows compatible program that produces disease rates using variable spatial filters and tests for their statistical significance using Monte Carlo simulations. The program computes values that are inputs to GIS software that will produce disease rate maps and maps of statistical significance. Input data are either individual disease records and individual at risk records or are aggregates of the above.

EpiGrass

Epigrass is a software for visualizing, analyzing and simulating of epidemic processes on geo-referenced networks.

EpiInfo – Closed Edition

With Epi Info™ and a personal computer, epidemiologists and other public health and medical professionals can rapidly develop a questionnaire or form, customize the data entry process, and enter and analyze data. Epidemiologic statistics, tables, graphs, and maps are produced with simple commands such as READ, FREQ, LIST, TABLES, GRAPH, and MAP. Epi Map displays geographic maps with data from Epi Info™.

EpiInfo – Community Edition

Epi Info™ is a public domain suite of software tools designed for the global community of public health practitioners and researchers. It provides for easy data entry form and database construction, a customized data entry experience, and data analyses with epidemiologic statistics, maps, and graphs for public health professionals who may lack an information technology background…. Epi Info™ Community Edition is the open source project to reproduce the popular Epi Info™ suite of tools in C#, with the goal of developing a data collection and analytics system for public health that is highly scalable, platform independent, and database agnostic.

ESTAT – The Exploratory Spatio-Temporal Analysis Toolkit

Developed by the GeoVISTA Center in close cooperation with users at the National Cancer Institute, the ESTAT toolkit provides user-friendly, open-source software designed to support exploratory geographic visualization. While developed initially to support cancer research, ESTAT is designed to handle any kind of spatial data with attributes. If you have an ESRI ArcGIS shapefile, you can … quickly convert your data into something ESTAT can use.

Flowmap

Flowmap is a software package dedicated to analyzing and displaying interaction or flow data. This type of data is special in the sense that there are two different geographic locations connected to each data item: An origin location where the flow starts and an destination location where the flow ends. The flow data itself can be people (e.g. commuters, shoppers, hospital visitors), goods, usage of agricultural services or telecommunication and so on.


Free Tools For ArcGIS

Several free tools for ArcGIS from Jenness Enterprises, including ESRI International User Conference prize winners. Don’t currently work on ArcGIS 10, but that may change.

Repeating Shapes Tool – “This tool generates an array of repeating shapes over a user-specified area. These shapes can be hexagons, squares, triangles, circles or points, and they can be generated with any directional orientation.”

Tools For Graphics and Shapes – “This extension includes a large suite of tools for calculating geometric attributes of vector features and for selecting and naming graphics. All tools are available at the ArcView license level. Among many other functions, this extension offers tools for calculating the true area and centroid of polygons as they lay on the sphere, thereby avoiding errors caused by projection distortions. This extension also offers tools to calculate true lengths of polylines as they lie on the spheroid, using Vincenty’s equations. This manual thoroughly explains all algorithms used to calculate geometric attributes on the sphere and spheroid.”

DEM Surface Tools – “This extension provides you with tools to generate a variety of surface characteristics of a landscape, using both projected and unprojected (i.e. latitude / longitude) digital elevation model (DEM) rasters. These tools include:

  1. Surface Area and Ratio of a landscape
  2. Slope, with 3 slope algorithm options
  3. Aspect, with 3 aspect algorithm options
  4. Hillshade, with optional hypsometric tinting
  5. Multi-directional Oblique-Weighted Hillshade, with optional hypsometric tinting
  6. Six types of Landscape Curvature”

Raster Extractor – “The Raster Extractor tool allows you to extract any number of rasters from an existing raster catalog and load them as individual rasters in your map, thereby allowing you to analyze them in ways that the Raster Catalog does not allow. The tool also gives you the option to mosaic all the rasters into a single raster dataset, modify the cell size and trim the final raster to the visible extent.”

Corridor Designer Toolbox – For designing corridors for the free flow of wildlife through urban landscapes. Includes a general designer, corridor evaluation tool, and land facet corridor design tool. Notes on website suggest that this is unlikely to be upgraded to ArcGIS 10 compatibility.


Daylight Hours Explorer

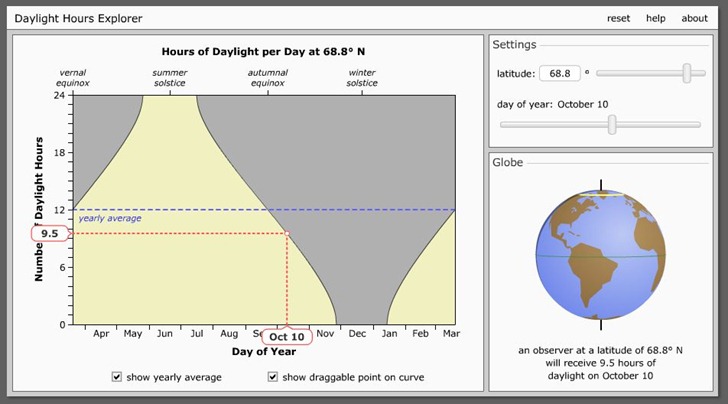
Daylight Hours Explorer is a simple online tool to visualize how many hours of sunlight a particular latitude gets during the course of a year. Move the upper-right slider to change the latitude; move the lower-right slider to change the date, with hours of daylight below the globe. With “show draggable point …” checked, you’ll see the dotted lines on the graph, and also be able to change the date by clicking and dragging on the point on the curve:

daylight

Option to show yearly average (as above). You can also click and drag the globe to spin it around, useful for seeing how the day/night terminator orientation changes with time. Links to download the Flash animation to your desktop for offline use. From the University of Nebraska-Lincoln Astronomy Department; site has lots of additional animations, most astronomy-oriented (but a few with geographic connections).


Near-Real-Time US Airline Flight Visualization In Google Earth

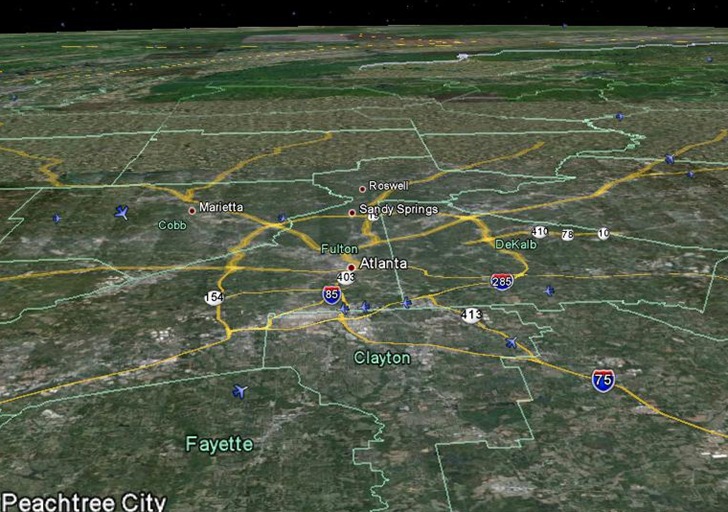
New from Google, a Google Earth network link that shows near-real-time US flight positions, full 3D position:

3datlanta

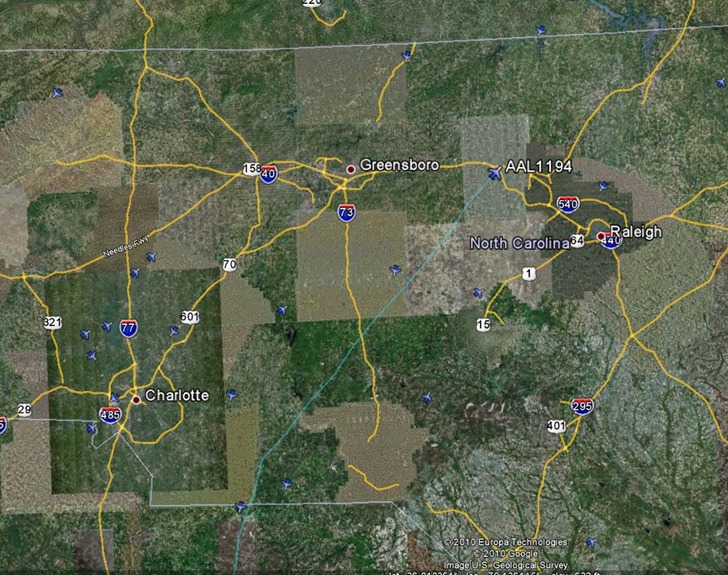
Mouse-over a plane, and see the route it’s taken up to that point in blue:

route

Click on a plane, and get a pop-up with flight info, on-time status:

bubble

Click on “Download flight path”, and download a KML time animation of the plane’s flight to that point; click on the play button at upper right to start the animation.

Flight info is delayed roughly 15 minutes.

Via Google LatLong Blog.


Compare Point Latitudes And Longitudes With Iso-Longitude-Latitude

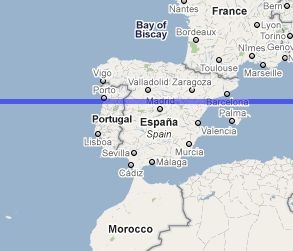
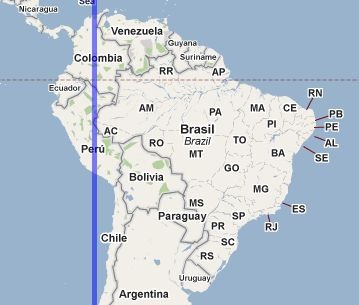
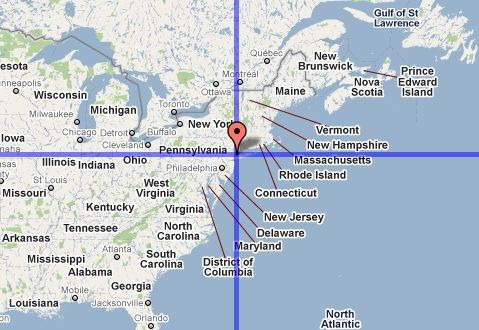
For some reason, I have this mental picture of Europe being at about the same latitude range as the US, and I’m often startled when reminded that much of Europe lies well north of the lower 48’s northern border. The Iso-Longitude-Latitude site shows this graphically; put a marker on a point in a Google Maps interface, say near New York City:

nyc

And lines of constant latitude and longitude will be drawn through that point in the first map window, and in a second one directly below it. By scrolling the map eastward, I can see that Madrid is at about the the same latitude as NYC:

madrid

And that most of South America is east of NYC:

sa

You have the option of showing the “anti-latitude” and “anti-longitude” of a point as well; anti-latitude is the equivalent south latitude of a northern latitude (and vice-versa) e.g. +40 and -40, while anti-longitude is180 degrees opposite longitude, e.g. –75 and +115. “Anti” lines are drawn in red.

You can enter multiple point positions on a map, and their coordinates will show up in a text box; alternately, you can copy and paste coordinates into the text box and display them on the map. Finally, you can save a URL that will save and display all the points you’ve entered.


Distances And Calories Burned With The Gmaps Pedometer

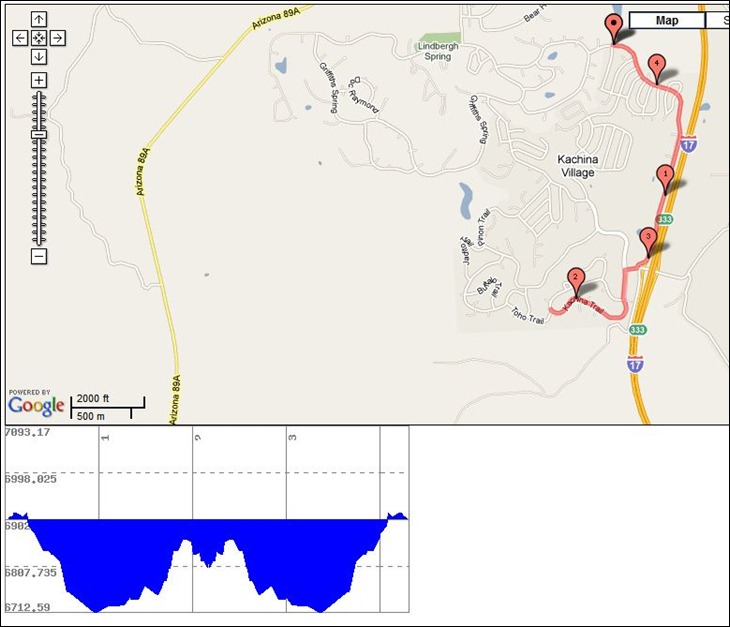
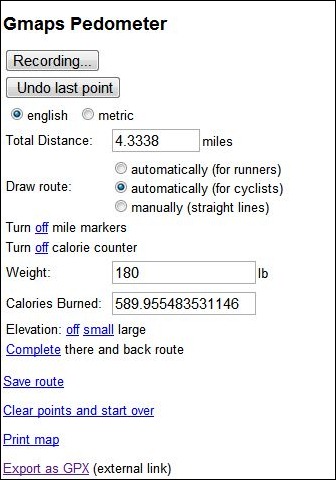
Another route-drawing app for Google Maps, but with some unusual features. The Gmaps Pedometer lets you create a route by clicking in a Google Maps interface, as do many other similar apps. Some of its features are:

  • The route can be straight lines between points, or be automatically routed for either running-friendly or cycling-friendly routes
  • Optional mile markers can be drawn along the route
  • Total route distance is calculated on the fly
  • You can display a graph of elevation change over the route
  • You can automatically do an out-and-back calculation for a return trip by the same route
  • Enter your weight and get an estimate of how many calories you’ll burn
  • Save the route as a permanent link
  • Print the map
  • Export the route to GPX (this is an external link to the GMapToGPX site)

Map/route and elevation display:

mapandelevationdisplay

Control panel and info readout:

cp

Tips:

  • Set all parameters (units, calorie counting, mile markers, etc.) before you start adding points; there doesn’t seem to be a way to change those after you’ve created the route and have those changes reflected in the map/display
  • Press the “Start Recording” button to start entering points, and double-click on the map to enter a point
  • If you want to export the route as a GPX, you should visit the GmapToGPX site first, and configure your browser as indicated to allow GPX export.
  • I modified the Gmaps Pedometer link slightly so that it would start out centered on the US; to customize it for your own center point, take the link URL (http://www.gmap-pedometer.com/?centerX=-90&centerY=35&zl=13&fl=m) and substitute your desired longitude for the centerX value, and latitude for the centerY.


Everything Sings: Maps For A Narrative Atlas

Several posts at other blogs over the past week about cartographer/artist Denis Wood’s upcoming book Everything Sings: Maps For A Narrative Atlas; see Making Maps and The Map Room for examples. This looks like a unique depiction of aspects of a community not captured by normal maps, sort of a true geography of neighborhood. Showed this to a friend who’s interested in maps as way of framing the distinguishing aspects of a community, and she pronounced it, “Great Stuff!”. Exploring outward from the blog posts, I found direct links to a number of sites of interest, either directly or tangentially related to the book:

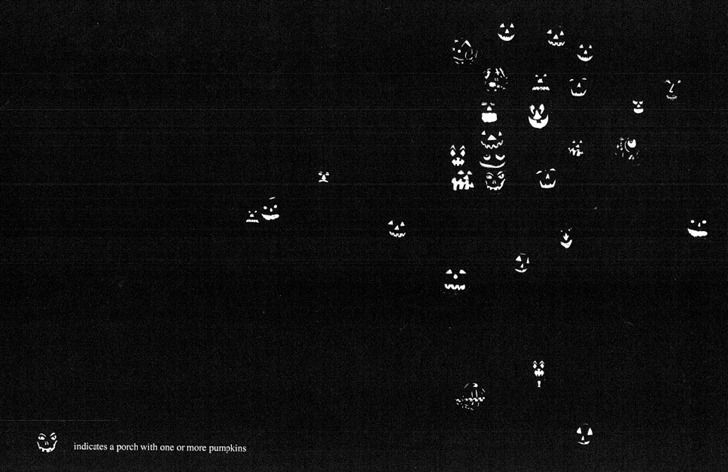
  • An earlier post on Making Maps on earlier versions of these maps, including PDF links to some of them, like this oft-seen one of jack-o-lanterns on Halloween:

pumpkins