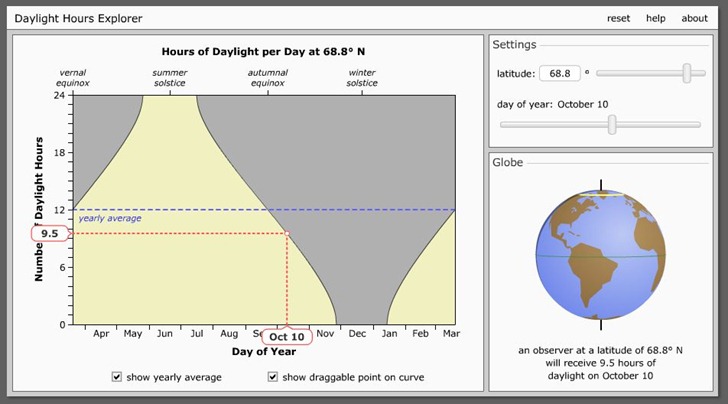
Daylight Hours Explorer is a simple online tool to visualize how many hours of sunlight a particular latitude gets during the course of a year. Move the upper-right slider to change the latitude; move the lower-right slider to change the date, with hours of daylight below the globe. With “show draggable point …” checked, you’ll see the dotted lines on the graph, and also be able to change the date by clicking and dragging on the point on the curve:

Option to show yearly average (as above). You can also click and drag the globe to spin it around, useful for seeing how the day/night terminator orientation changes with time. Links to download the Flash animation to your desktop for offline use. From the University of Nebraska-Lincoln Astronomy Department; site has lots of additional animations, most astronomy-oriented (but a few with geographic connections).