I posted not too long ago about Microsoft Pivot, a unique data visualization tool that can be used for geographic classification if a dataset includes a geographical component:
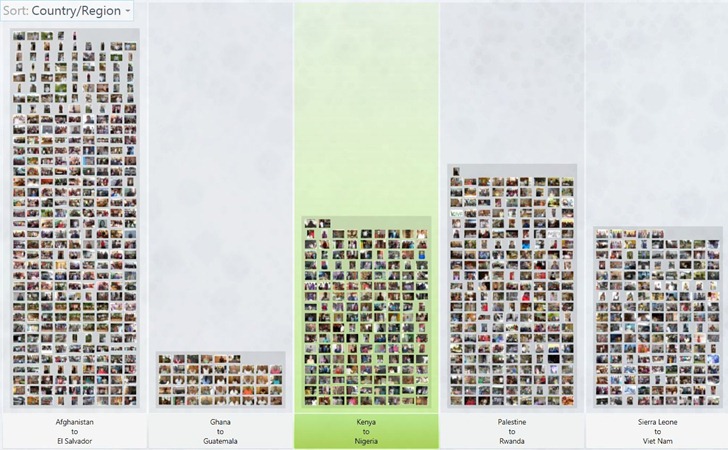
At the time, you could only use Microsoft’s own sample datasets, not your own. Microsoft has just released information about how to create your own Pivot dataset, called a “collection”; see their PivotViewer Info page for links to more information. You used to need a stand-alone app to view the data, but Microsoft has released a Silverlight-based widget that will let you embed Pivot into any web page.
Microsoft Live Labs’ beta Pivot software lets you slice, dice, analyze and examine data, including geographic data, with a unique, animated visual interface. You can’t currently use your own data, but several sample datasets have geographic attributes, including:
- National Parks
- World Leaders
- Endangered Species
- Sports Figures
- Kiva Loans
Here’s a screenshot of Kiva loans grouped by alphabetical country groups:
Continue reading ‘Slice And Dice Data With Microsoft Pivot’
With 895,000 records and 1,115,000 names, the Getty Thesaurus Of Geographic Names Online lets you look up position and hierarchical data for geographic features around the world:
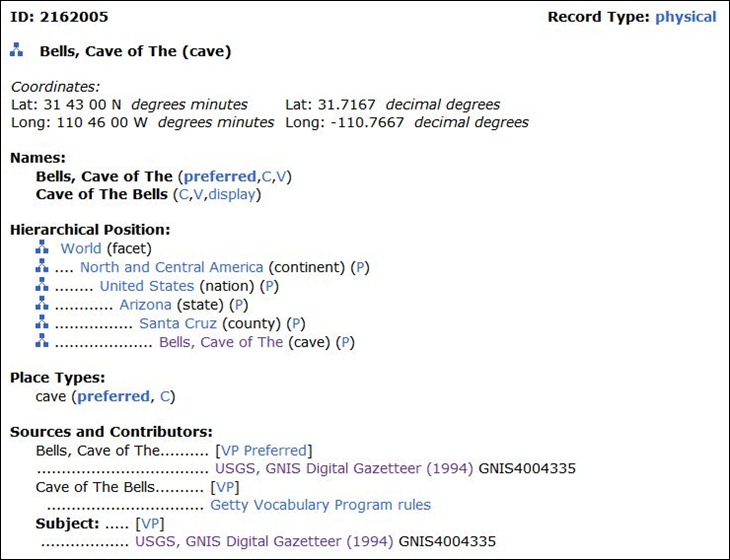
The position data is described as “approximate and … intended for reference (“finding purposes”) only”; a few test cases showed that the positions ranged from spot-on to over a mile off for locations in the US. Lookup can be by name only, or limited by type of geographic location and nation; Boolean and wild-card operators are supported.
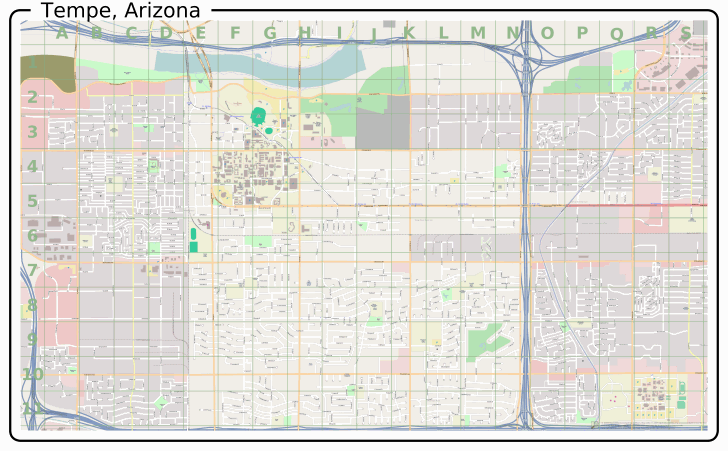
MapOSMatic – Select an area by a bounding box, or by administrative boundaries (database for the latter is currently very limited), and get a map of the area in PNG, PDF, and/or SVG format, with letter/number grid indexing:
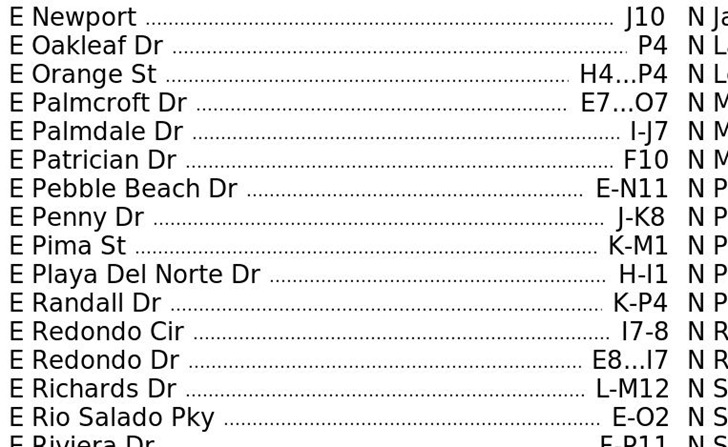
And also get a street index for that map referenced to the letter/number grid:
OSM Extractor: Select an OSM map area by bounding box, and download georeferenced raster or vector data for that area. Vector data is available in shapefile or native XML format, but to limit its size, you have to zoom in to city level to download it. No such area limitations on raster data in GeoTiff format:
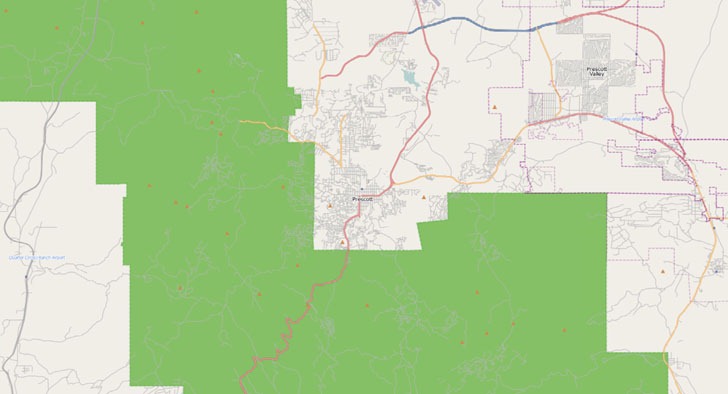
But it only saves the data in screen resolution, which limits the detail level. All data is in geographic (Plate Carree) projection, WGS84. If you have a pop-up blocker, you’ll need to set an exception for “vizure.com” so that the data download pop-up can appear.
Via SlashGeo.
If you’re a locavore (“one who tries to eat only locally grown foods”), you may find Epicurious’s Seasonal Ingredient Map useful. Pick any month, then click on your state, and it shows you a list of currently-available local produce:
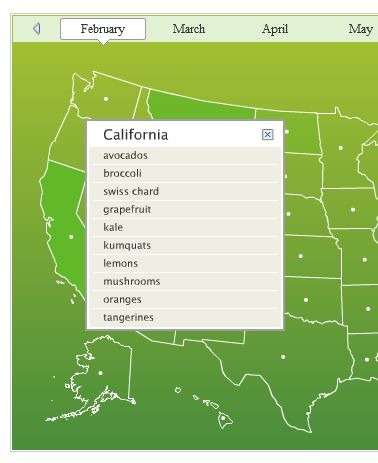
Mouse over a produce item, and get links to produce definitions, pictures, recipes and cooking tips. Not perfect, especially for states with a wide variety of climate zones. For Arizona, it says the growing season is currently dormant, but there is fresh produce currently being grown in the warmer southwest corner of the state.
Via Lifehacker.
The US National Park Service Data Store site offers access to GIS data for US National Parks And Monuments in a wide variety of subjects and formats, including:
- Biology
- Cultural Resources
- Aerial imagery
- Roads and trails
- Noxious/alien plants
- Soils
- Land use / cover
- Plus dozens more ….
For geology (a favorite topic of mine), there’s a related NPS Geologic Resources Inventory Publications web page listing the geology data available for most US National Parks and Monuments, including some that you wouldn’t expect it for; here’s a geology map for Abraham Lincoln’s Birthplace National Historic Site generated from the GIS data, from the summary report:
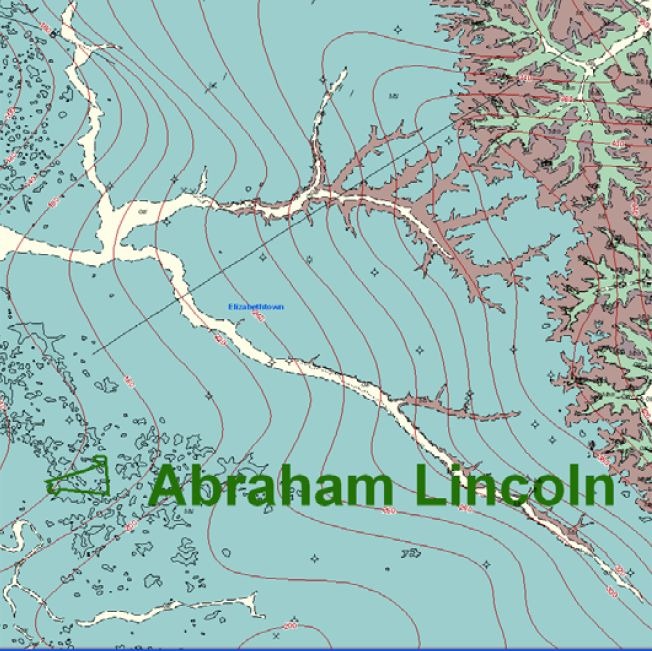
Parks can have any or all of three different types of reports: scoping summaries, geologic reports, and digital geological mapping data in GIS format. Scoping summaries and geologic reports usually have extensive references to additional information about park geology. Links to geology GIS data are “preset” links to the NPS Data Store for that information.
The AfricaMap website from Harvard University offers dozens of vector and raster datasets that you can display inside of a Google Maps interface. Data categories include geographic, political, economic, environmental, linguistic, ethnic, historic and more. Most of the datasets can also be download in GIS-compatible formats, with a fair number also available in Google Earth KMZ format (indicated by a “3D” link in the data listing). Here’s a display of African language families from 2001, for which you can also download the original shapefile data:
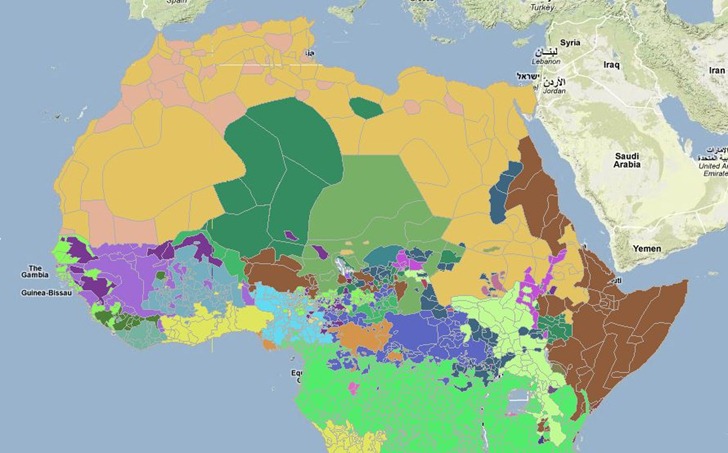
Zooming in will display labels, but you can also bring up a pop-up window with the map legend inside.
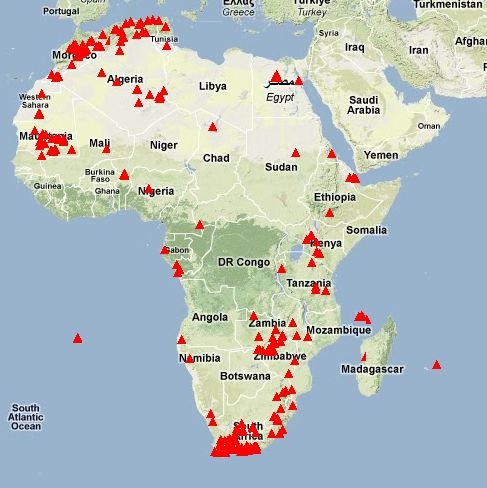
There’s also a “Places” tab that lets you plot point geographic locations for cities, lakes, canals, marshes, mountains, plateaus, and many more. Here’s a plot of gorges in Africa:
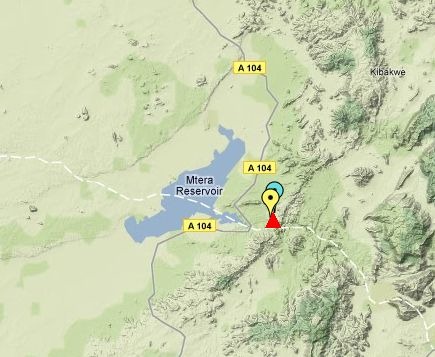
Zoom in closer to an area:
Click nearby a plotted location, and get a pop-up window with more information on the feature: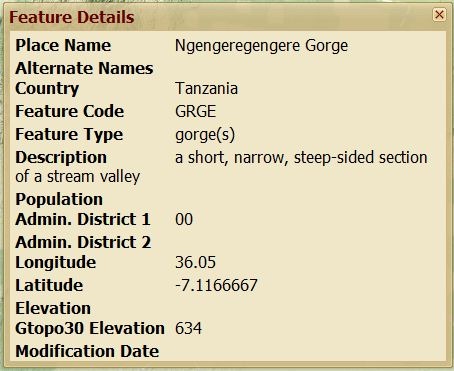
The Open Street Map project is working to create a freely distributable map dataset for the world, generated by volunteer effort. Much of the data is derived from publicly-available government data, GPS tracks, and manual tracing over aerial imagery. The Walking Papers project offers an alternative method of recording and adding data to the Open Street Map, more suited to ground-based observation and recording. Zoom in to an area, download a PDF of the map, and print it out; you have options to download simple or complex road maps, cycling-oriented maps, even topographical maps. Take it into the field, and write notes or draw geographical features directly on it; here’s a sample road map from France:
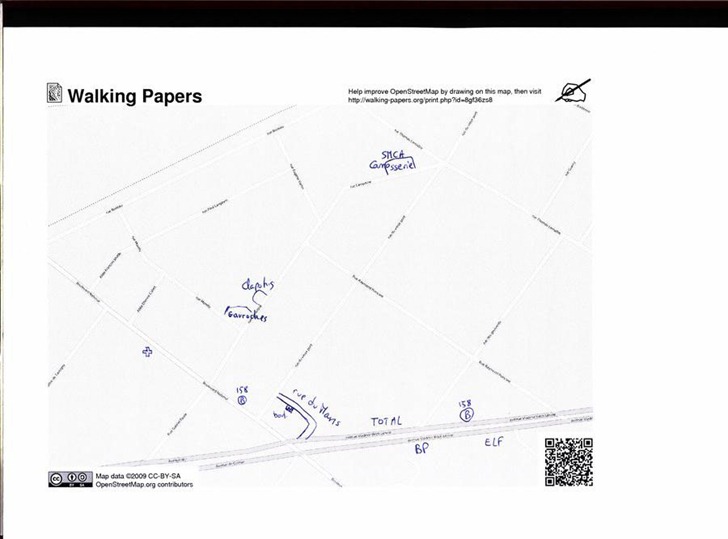
The square in the lower right has coded information about the location and scale of the map, and I’m guessing the squares help calibrate the map image. When you’re done annotating the map, scan it and upload it back to the Walking Papers website. You can then open up an OSM editor with the scanned map in the background, georeferenced so that it lines up with the existing data:
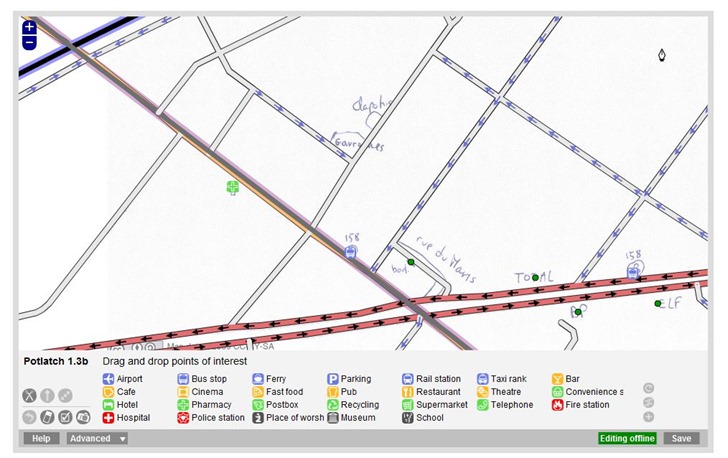
Use the editor to trace over the hand-drawn data, adding it to the OSM database.


