blankblank blank


Archive for the 'data' Category Page 6 of 19


Full Natural Earth Data Now Available – Free Vector And Raster Data For The Entire World

Tom Patterson’s raster Natural Earth data has been available for a while, and it’s now been joined by the Natural Earth vector datasets, a joint project with Nathaniel Kelso and others; there’s now also a new home for both datasets at the Natural Earth website. Vector data is available at 1:10 million, 1:50 million and 1:110 million scales. Vector data features include:

  • Country boundaries
  • Administrative boundaries
  • Populated places
  • Coastlines
  • Lakes and rivers
  • Glaciated areas
  • Bathymetry
  • Latitude/longitude graticules

… and much more; see the full feature set description for details. Vector data is in standard shapefile format, geographic/WGS84 projection. The authors solicit both additions and corrections to the dataset. It’s good to have a high-quality free dataset of this type available in one place; while you can find comparable or even higher-quality data on the Web, it usually involves quite a bit of searching.
kmlfactbook – The CIA World Factbook In Google Earth Format

The CIA World Factbook …

provides information on the history, people, government, economy, geography, communications, transportation, military, and transnational issues for 266 world entities. Our Reference tab includes: maps of the major world regions, as well as Flags of the World, a Physical Map of the World, a Political Map of the World, and a Standard Time Zones of the World map.

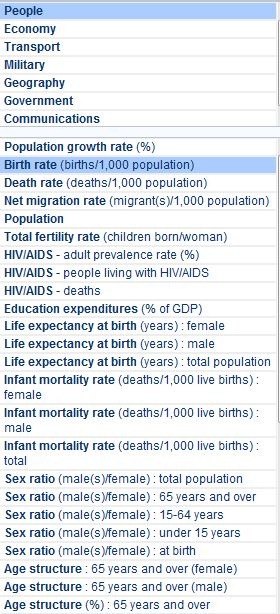
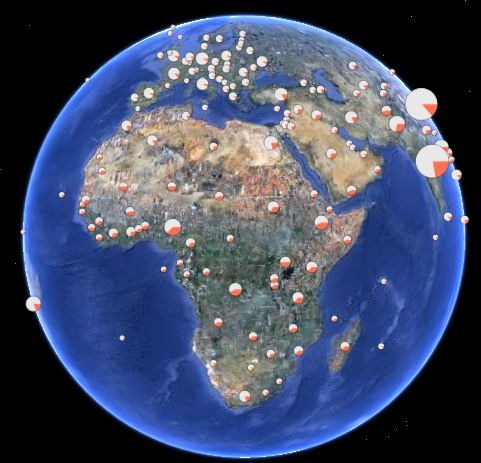
In short, it’s the go-to source for current world demographic, economic, social and political data. David Tryse has taken data from the Factbook and created an online application, the kmlfactbook, that generates thematic maps in KML format for use with Google Earth. Select a dataset:

factdataset

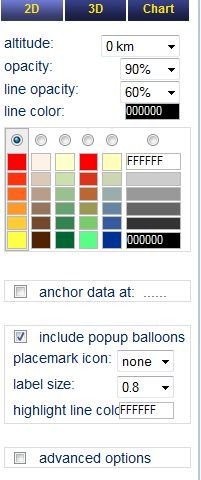
Then choose a chart type, coloring scheme and other options:

charttype

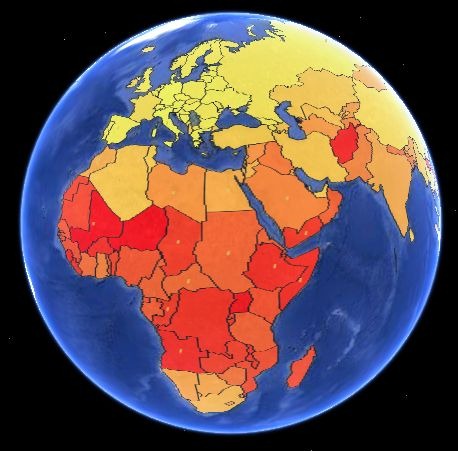
2D charts are flat choropleths:

2dchoro

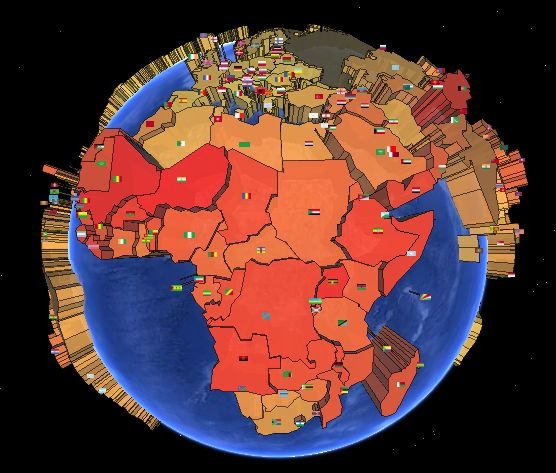
3D add scaling based on height:

3dchoro

And “Chart” creates a pie chart:

piechart

There’s a Google Earth plugin view that lets you preview the appearance, and when you’re happy, you can export a KMZ file. And you’re not limited to CIA World Factbook data; if you register on the site, you can upload your own data to convert it to a thematic KMZ file.

The one thing that seems to be missing is the ability to create a map legend to show what the color codes represent (or at least I couldn’t find it); you can click on placemark icons on each country to get the data, but it’s not the same. Hopefully, legends will be added soon.

Via Google Earth Blog.


Mashup And Map Demographic Statistics With DataMasher

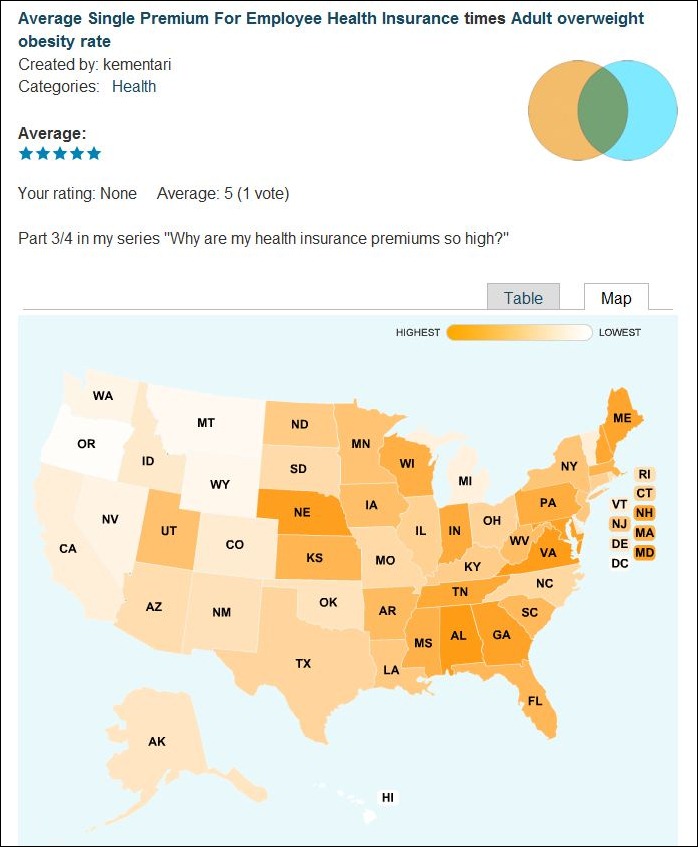
Take one of DataMasher’s 90-odd datasets (demographic, economic, energy, health, etc. data by US state), add/subtract/multiple/divide it by another dataset, and plot the results as a choropleth map (plus get the results in tabular form):

2009-10-31_204803

Mashups are posted publicly for comment and ratings. Results may be significant, or be totally devoid of meaning; YMMV. DataMasher makes no claims as to the statistical validity of any of the maps created. You can also select and plot individual datasets by themselves. There’s a short video on how the process currently works, and DataMasher promises more datasets and capabilities are coming.

Via Lifehacker.


Historical Marker Database

The Historical Marker Database (HMdb.org) is a voluntary effort to document and catalog historical markers, mainly from the US and Canada (a few markers from foreign countries are also listed). Markers are listed by category and state; you can also search by multiple parameters (keywords, postal code, county, etc.). Marker info pages have a photo of the marker, a copy of the marker text …

histmarker

… latitude/longitude of the marker, a context photo showing the general surroundings of the marker, and a list of other nearby markers. A link will take you to a Google Maps page showing the location of the marker and other nearby markers; a link at the top of the map page will let you download a GPX file with all the marker positions for upload to your GPS unit (TomTom POI files are also available). There’s even a custom version of the page for mobile phone; enter your latitude/longitude and get a listing of up to 20 markers near your current location.

The site also accepts submissions of historical makers not yet in the database (requires free registration).


Embeddable US Demographics Map

As a demo of the ArcGIS API for Flex, ESRI has a new page that lets you create an embeddable/shareable map of demographic data by US county. Only seven datasets available now:

  • Median Household Income
  • Population Change 2000-2009
  • Population Density (per sq. mile)
  • Median Home Value
  • Unemployment Rate
  • Average Household Size
  • Median Age

Map creation is trivially easy – select the demographic dataset from a dropdown, zoom the map to the desired extents, set a map size in pixels, and you’re done; links to a map with your parameters, and code for an embeddable map, are generated automatically. Here’s an embedded map, scrollable and zoomable; unemployment rate is the defaultdataset, but you can choose other sets with the dropdown menu at upper right:

More datasets would be nice, as would control over colors and ranges …

Via GIS And Science.


Mapping Anthropogenic Biomes

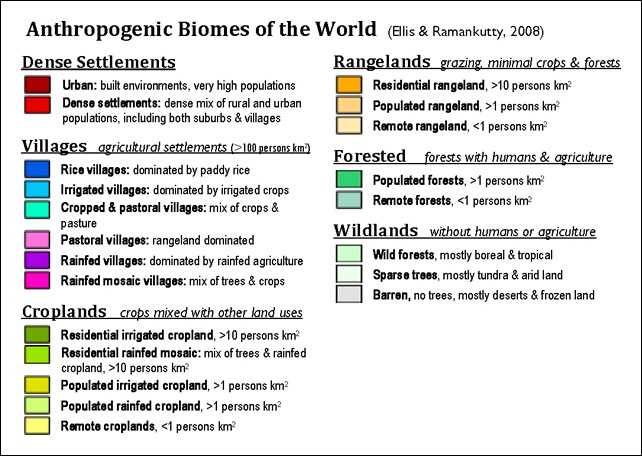
Yesterday’s post was about a site that categorized biomes with very fine divisions based on vegetation, soil moisture, surface lithology, etc., all with the underlying concept that for most areas this was a representation of an actual natural biome. The creators of the concept of anthropogenic biomes go in a different direction; they believe that the impact of man upon the natural landscape has been so profound, with only about 11% of the earth’s surface still truly6 wild,  that most of the biomes of the world must be described by at least partially including the effects of mankind. They’ve broken down biomes into just 21 categories:

Anthro_biomes_legend_v2

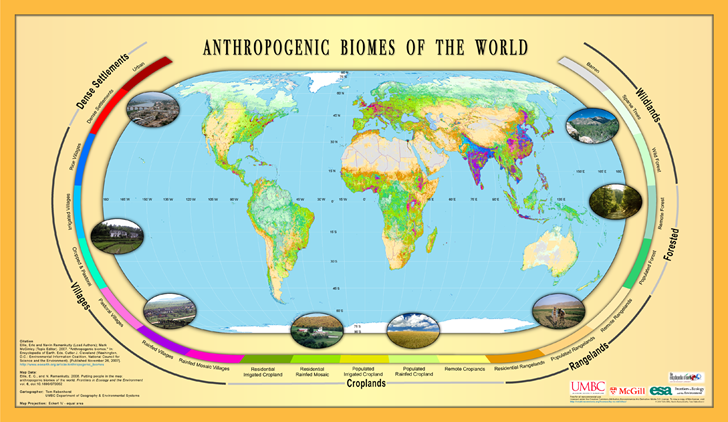
And created a world map using these categories:

anthrome_map_v1

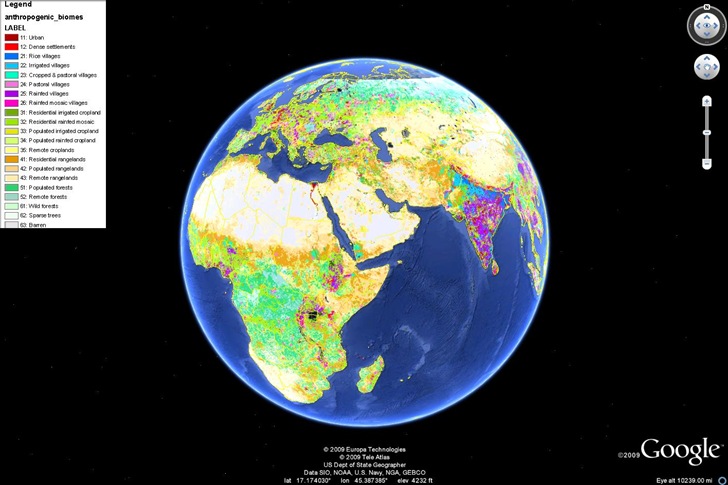
You can download a PDF of the above image, an ArcGrid file for use in ArcGIS, or a KML file for viewing in Google Earth on this page. Viewed in Google Earth:

anthrobiomes

Also available are map viewers for this data in Google Maps and Virtual Earth (latter didn’t work on Firefox for me).

You can watch a Discovery Channel video on the concept of anthropogenic biomes here.

Via Highly Allochthonous.


High-Resolution Terrestrial Biome Data

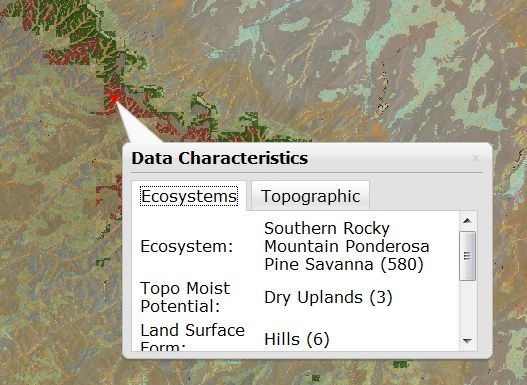
The USGS Global Ecosystems Viewer (background info here) lets you view terrestrial biome data in very fine detail, with extensive categorization levels. Coverage is currently limited to the US, but the background page indicates that the rest of North America, South America and Africa are currently being worked on. Click on the map, and get a popup detailing vegetation classification, lithology, moisture, terrain, and other data:

biomepopup

For this example, the Ecosystems data is:

Ecosystem:
Southern Rocky Mountain Ponderosa Pine Savanna (580)

Topo Moisture Potential:
Dry Uplands (3)

Land Surface Form:
Hills (6)

Surficial Lithology:
Non-Carbonate Residual Material (3)

Isobioclimate:
Upper Supramediterranean Dry (51)

and the Topographic data:

Elevation:
2248 meters

7375 feet

Slope:
8°

Aspect:
102° (E)

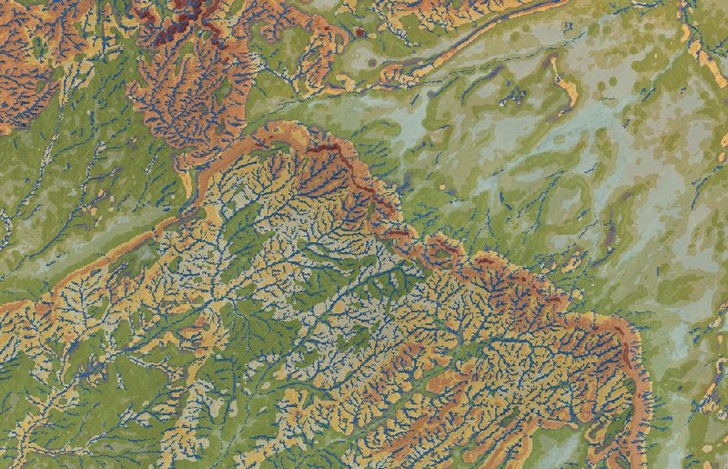
You can also do a colored plot of any of the ecosystems parameters by themselves, like this one of the Surficial Lithology:

surfaceforms

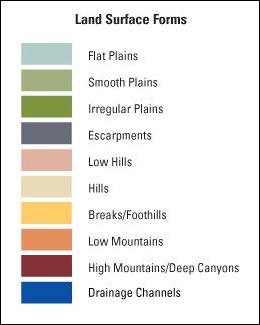
With a button to bring up the legend in a pop-up window:

formslegend

Background imagery can be satellite photos (as in the example above) with and without borders and placenames, topographic maps (USGS 100K), or no background at all. Finally, you can order data for your current view for download in georeferenced format (UTM, Albers or geographic projection) in ArcGrid, GeoTiff or ERDAS IMAGINE formats. Data will be prepared and available for download via FTP; you get email notice of this, but there’s also a status update page you can use. When I tried it, the data was ready for download in less than five minutes.

Via Spatial Sustain.


Free Vector Country Borders, Administrative Boundaries, And Soon More

Wish I’d known about this site when I was hunting for a high-res border outline for the province of Umbria in Italy. The Global Administrative Boundaries website offers free vector GIS data for country borders and administrative areas within those borders. Data is available in geographic coordinates (lat/long), WGS84 datum, in multiple formats:

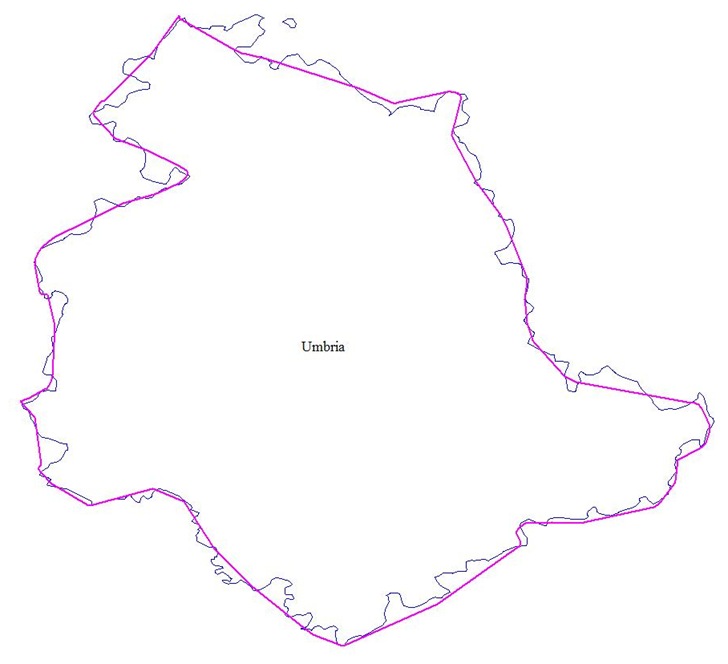
Coverage is worldwide for level 1 data (country borders), but diminishes as you go down as far as level 4 (sub-administrative units), though for the latter there are some countries for which such a data level isn’t relevant. You can see maps of current level coverage here, and missing data will likely be added in the future. Data is licensed under Creative Commons for the US; other unspecified terms may apply for the rest of the world. Here’s the Italian province of Umbria, with the best free data I could initially find plotted in purple, and the high-res GADM data in blue:

umbria

Via Slashgeo.

Just around the corner, scheduled for unveiling at the October 2009 NACIS conference, is Natural Earth Vector. While there’s some overlap with GADM at the upper boundary levels, Natural Earth Vector may not include some of the finer administrative boundaries available in the GADM . But it will have a wide variety of other geographic features not available in GADM in vector format at multiple zoom levels (list from the web post):

  • Continents (North America, Europe, Asia, etc)
  • Cultural regions (South Asia, West Africa, etc)
  • Countries (US, Canada, Mexico, etc)
  • Country sub-divisions (for the US, states, semi-independent territories, dependencies, associations)
  • Disputed territories (like Kashmir, Northern Cyprus)
  • 1st order admins (states, provs)
  • Bathymetry
  • Lakes
  • Lake Center Lines
  • Rivers (including attributes that allow easy “tapering” of drains)
  • Islands
  • Glaciers
  • Populated places (urban boundaries, not city points)
  • Cities (point locations)
  • Physical features like peaks, ranges, valleys, plains

I’ll try to post again when it’s officially released.

Via Kelso’s Corner.