blankblank blank


Archive for the 'data' Category Page 4 of 19


Crowdsourcing And Coordinating Data Collection With Handheld GPS Units

Got an email today from someone with a data collection/coordination/assembly problem. They have multiple people out in the field with Garmin GPS units recording data, and bringing it back to a central location for collation/combination when they’re done. Since Garmin GPS units have limited capabilities for data storage – coordinates, name, comment, date and time, elevation, and that’s pretty much it – additional data associated with a point has to be recorded by hand. Once back from the field, data has to be downloaded from individual units, associated with the additional attribute data from forms, all the data combined together into a single dataset, then converted into GIS-friendly format. And the process they had come up with wasn’t really working well for them.

I think this highlights some of the major limitations of classic stand-alone handheld GPS units. They’re really designed for us in personal data collection, not combined data collection; assembling data from multiple units can take a lot of work. Plus, their limited data collection capabilities require offloading data attribute acquisition to other formats (e.g. pencil and paper), adding the addition problem of associating that data with coordinates later on. There are lots of professional solutions for these problems, like Trimble or MobileMapper GPS units, Terrasync and ArcPad software, but these can be complicated and expensive. I challenge you to find anyone with enough patience to use Terrasync for a single day without swearing at least once; I know I can’t  ;-).

For a few years, I’ve had CyberTracker on my list of potential topics to post on. CyberTracker is a terrific data acquisition and collation tool for field data with tons of great features, like custom data acquisition form design for easy data entry, moving maps, easy data collation and conversion to GIS-friendly format. Plus, the software is free, and the hardware is (relatively) affordable. But unfortunately, I think time and technology are passing Cybertracker by:

  • While the central data software runs on Windows, the field data collection software runs on old-school Palm OS and Windows Mobile. Palm OS is dead; Windows Mobile development has stopped with version 6.5, and only maintenance updates are scheduled. So the useful lifetime of any data collection system built around CyberTracker is limited. If you need a fast/cheap/short-term solution, CyberTracker is free for non-profit use, and you could probably pick up the hardware very cheaply on eBay. Long-term, I don’t see it having much of a future in its current form.
  • The data collation model is also becoming obsolete. With CyberTracker, you have to bring all the data units to a single data download/collation computer. While there are still places in the world where this might make sense, an increasingly-connected world means that data download/collation to the cloud instead of an individual computer makes more sense.

I’m really excited about the possibilities for crowdsourced geographic data collection and collation using portable devices running Android OS (yeah, iOS too). There are already several interesting apps for doing this, and I hope to cover some of those soon on my AndroGeoid website. And I suspect that the small number of apps that can currently do this will be quickly joined by far more apps, and far more capable apps, in the very near future. But that doesn’t help with my emailer’s current problem. I suspect there are many different ways you could do this, but here’s the first approach that came to me using all-free software and services.

1. Make sure that everyone on the project has a Google account (i.e. Gmail); completely free.

2. Have the project leader created a single main data spreadsheet on Google Docs, with all the desired data attributes (e.g. point name, coordinates, comments, additional data fields from the paper forms, etc.) and share a link to that spreadsheet with other project members so that they can edit it as well.

3. Project members can download data from their Garmin units using DNRGarmin, and then export the data from DNRGarmin in CSV format.

4. Load the data into the spreadsheet program of your choice, and add/edit data from data forms to make it conform to the data structure of the main Google Docs spreadsheet.

5. Copy the data cells in the spreadsheet program, and paste them into the main Google Docs spreadsheet. Note: Use Ctrl-C and Ctrl-V to copy and paste cells into Google Docs instead of using the Google Docs Edit menu to perform those operations, as the latter doesn’t seem to work for pasting data from different applications into Google Docs. You no longer have a single computer as a choke point for data entry; multiple people can add data to a spreadsheet at the same time, and Google Docs will coordinate data entry so that nothing is lost. And if you save the spreadsheet data from steps 3 and 4 as separate files, you’ll have backup copies of the original data as well.

For those who aren’t comfortable with working with spreadsheets, Google Docs lets you set up a “Form” to let anyone add data to a Google Docs spreadsheet directly; however, this increases the chances of coordinate data entry error.

6. Now that you have all the data centralized in Google Docs, you have lots of flexibility in how you can handle it:

  • Export the data in CSV format, and you can then import it into any GIS program that supports CSV data. If your GIS program doesn’t, use MapWindow to convert your CSV file into shapefile format first.
  • Unlike shapefile attribute tables, where adding/removing/re-ordering attribute data columns can be a pain, you can easily perform those operations in Google Docs and then re-export the data in CSV format.
  • Convert the data directly into a continuously-updated KML network link for display in Google Earth or Maps using Google’s Spreadsheet Mapper tool.
  • Use any of Google Docs built-in tools to analyze/plot/sort/visualize data, including their way-cool Fusion Tables.
  • And I’m sure there are more options I haven’t thought of.

Know an alternate approach? Have any additional ideas?  I welcome your links and suggestions in the Comments section below.


Do-It-Yourself Aerial Mapping At GrassrootsMapping.Org

The Grassroots Mapping wiki collects information, how-tos, current projects and general resources for creating your own georectified aerial imagery using cheap hardware to acquire the imagery (balloons, kites, and UAVs). Check out the main site for blog entries on current projects as well. From the website:

Seeking to invert the traditional power structure of cartography, the grassroots mappers used helium balloons and kites to loft their own “community satellites” made with inexpensive digital cameras. The resulting images, which are owned by the residents, are georeferenced and stitched into maps which are 100x higher resolution that those offered by Google, at extremely low cost. In some cases these maps may be used to support residents’ claims to land title. By creating open-source tools to include everyday people in exploring and defining their own geography, Warren hopes to enable a diverse set of alternative agendas and practices, and to emphasize the fundamentally narrative and subjective aspects of mapping over its use as a medium of control.

One of the resources highlighted is the Cartagen Knitter, a simple online application for knitting together multiple aerial images into a single one for georeferencing using GIS software or an online service like Map Warper. Here’s a video demo:

Cartagen warping tool demo from Jeffrey Warren on Vimeo.

More related videos here.


Geographic Polling Website SurveyMapper Now Live For The United States

The Centre for Advanced Spatial Analysis, University College London’s SurveyMapper site has been live for the United Kingdom for a while now, but just added the ability to do geographic-based survey polls for the United States as well as Europe and the entire world. The process for creating a survey couldn’t be easier. After free registration, click the “Create Survey” button; the first page will ask for basic info:

Continue reading ‘Geographic Polling Website SurveyMapper Now Live For The United States’


CIA World Factbook Data In Interactive Format

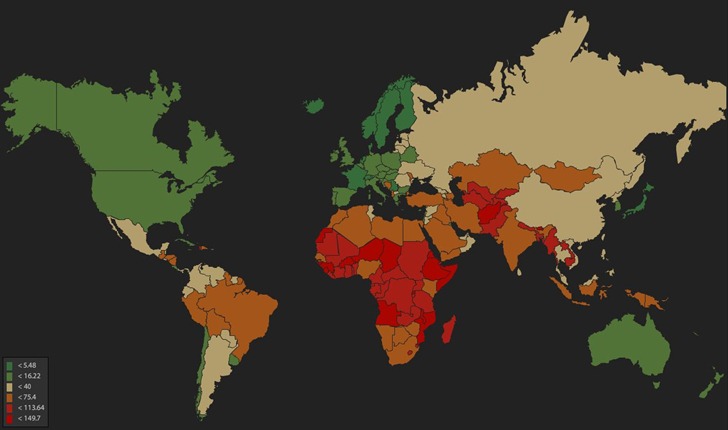
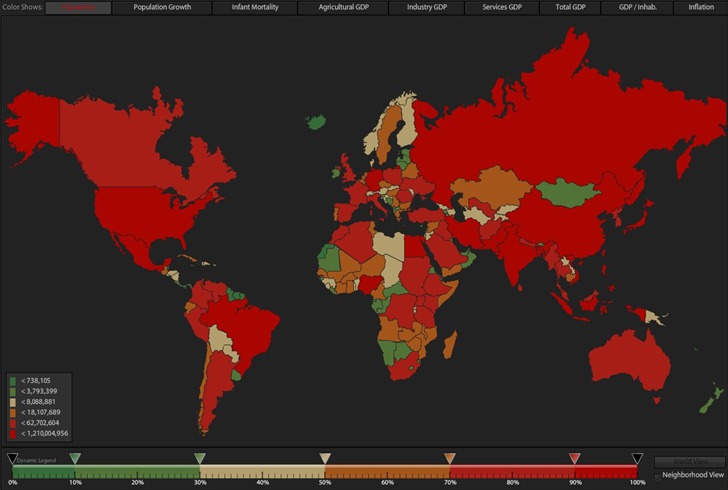
A very slick Flash visualization of CIA world geographic/economic/demographic data called the World Factbook Dashboard; it’s in Flash, so iPad users are out of luck. ;-). Start out with a map of the world, with colors denoting country population:

wfstartingview

You can adjust color for population ranges by moving the sliders at the bottom; plot a different index by clicking its name at the top, like infant mortality:

wfim

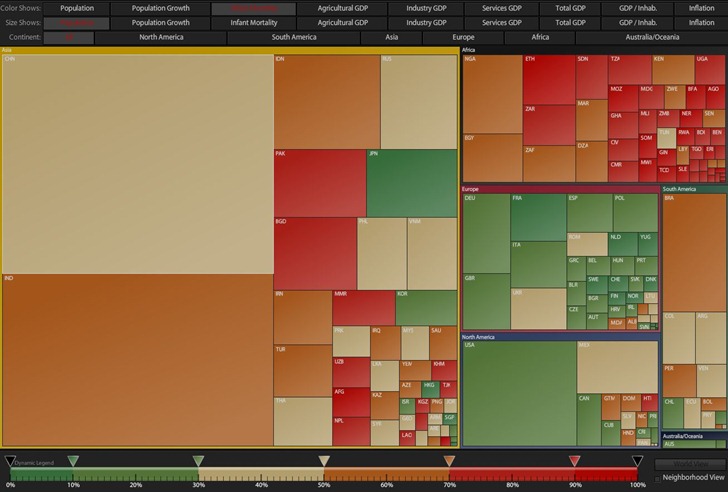
Plot multiple characteristics by clicking on the Treemap tab at top to get a “cartogram”-like view, like this plot where size is proportional to population, and color denotes infant mortality:

treemap

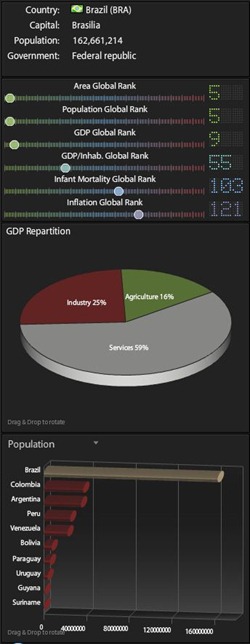
Click on a country in World Map or Treemap mode, and get its worldwide ranking for various parameters, as well as graphic comparisons to neighboring countries for selectable parameters, in a pane at left:

datapane

Lots more stuff to check out. Via Download Squad, which has a ten-minute video demoing some of its features.


US Wildfire Data

As you may have heard, there are three wildfires burning close to Flagstaff, Arizona where I live, the largest being a monster blaze on the east side of the San Francisco Peaks. Data on the extent and coverage area of the fire has been hard to find in local media, so I did a hunt on the Internet for the data. A lot harder to find than I thought it would be, especially in GIS-friendly format. Here are some of the resources I found:

Active Fire Mapping Program: A US Forest Service site.  Lots of promising links, but none of them were fully up-to-date, the WMS links were all dead, and the “Interactive Fire Detection Viewer” was inoperative (thanks, ArcIMS!).

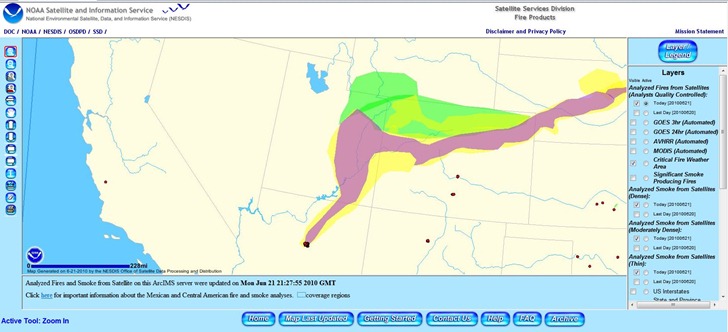
SSD Fire Detection Program Viewer: From NOAA’s Satellite Services Division. Somewhat more useful than the previous link; has a working map viewer with multiple data layers, including smoke plumes and up-to-date fire locations.

ssdviewer

But there doesn’t seem be an easy way to export the data in GIS-friendly format. There’s a download button, but it only gives the options of graphic and text data export, and the text data is in a very-unfriendly non-standard format.

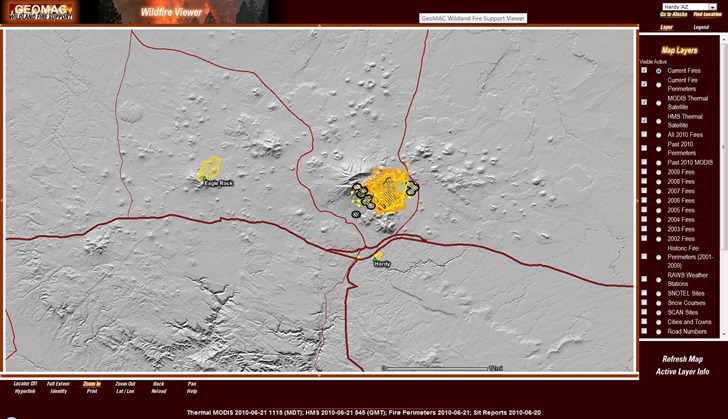
GeoMAC Wildfire Information: Geospatial Mult-Agency Coordination Wildland Fire Support site, put together by the Departments of Interior and Agriculture. By far the best site I found for current wildfire info. Note: You may need to enable pop-ups for this site.

First off, it has a working map viewer with understandable/relevant data layers. Here’s the current map viewer, with a more classic map-layer approach:

geomacviewer

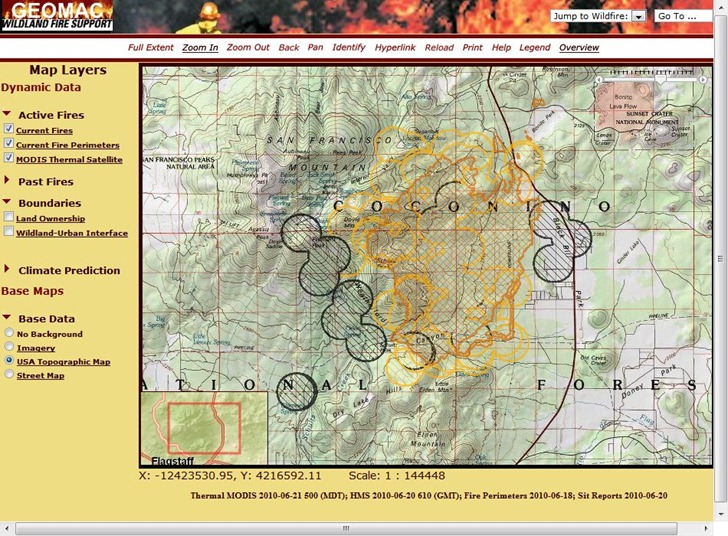
The beta viewer offers more background map layers, including satellite imagery, street maps and topo maps:

geomacviewerbeta

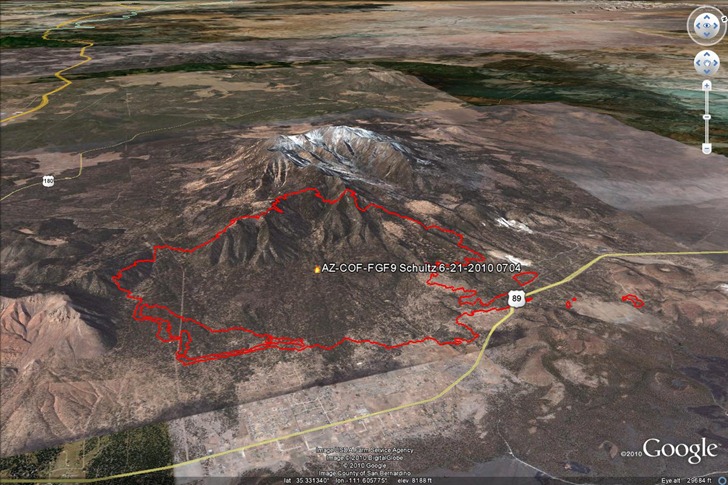
There are also links to GIS-friendly shapefiles, Google Earth KML files with current fire perimeter boundaries:

schultz621

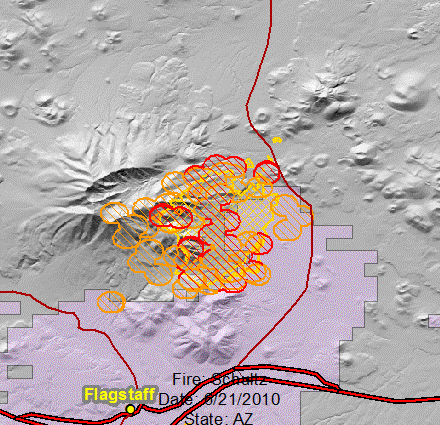
And a Quick View Active Perimeters buttons for a fast fire map, with legend:

Schultz-6_21_2010 (1) legend

HT to Dan Garcia for the GeoMAC site.


Where Americans Are Moving

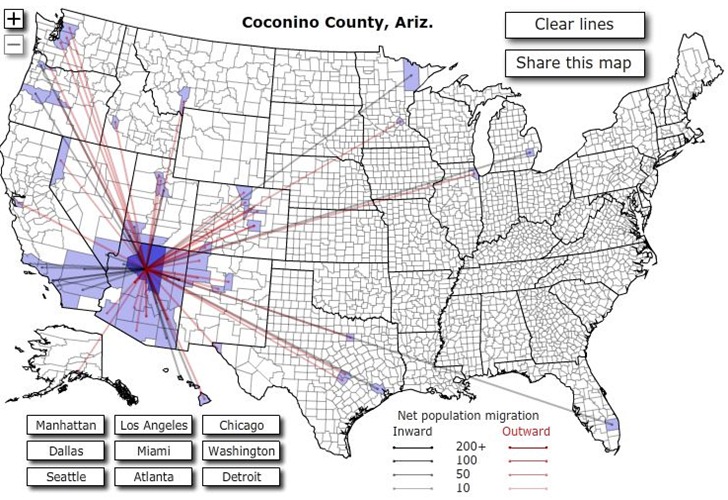
Forbes Magazine has an interactive US map showing migration patterns between counties in the US for the year 2008.
Click on a county, and lines connect that county to other counties where 10 or more people have either moved to that county (black lines) or away from that county (red lines):

migrationmap

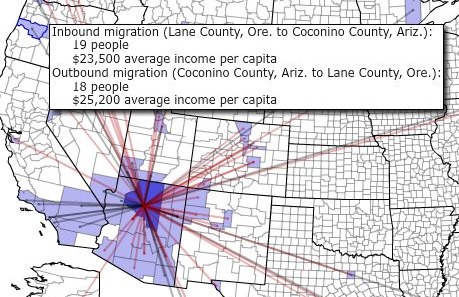
Mouse over a colored county to see the inward/outward numbers, and average per-capita income in both counties:

fullscreenmap

At least 10 people have to move in or out of a county for data to show up.

Via Kevin Drum’s blog.


World Vector Data (VMAP0 and VMAP1) In Shapefile Format

About three years ago, I posted about Penn State’s Digital Chart Of The World Server, which hosted old 1991/1992 VMAP0 world vector data from the National Geospatial Agency in E00 format. More recent data is available directly from the NGA, some of it in the higher-resolution VMAP1 dataset not available from Penn State, but the NGA data is in the uncommon VPF format that many GIS programs can’t handle. The Russian GIS Lab website has converted more recent VMAP0 and VMAP1 data into the more-commonly-used shapefile format, and made it openly available for download. You can get VMAP0 data for the whole world at this link, and the higher-resolution VMAP1 data for selected areas at this link.

While you can get similar and much fresher shapefile data for some of this info from the CloudMade OSM shapefile data site, and from the Natural Earth vector dataset, the VMAP0/VMAP1 files include data like railroads, utilities, cultural landmarks and others that can be difficult to track down.


Harvard Geospatial Library

The Harvard Geospatial Library is:

A collection of 6,871 worldwide and regional geographic data layers, scanned historic maps and associated descriptive information that can be searched mapped and downloaded for use for use with your GIS software.

A significant fraction of the data layers are listed as “Restricted” (e.g. ESRI data), meaning they can only be used by Harvard staff and students. Still, there’s a fair amount of freely-distributable data available, although it’s a pretty mixed bag of stuff. My attempts to use the Basic and Advanced search functions usually yielded few to no hits; better to click on the “Map Browse” tab and then pan/zoom the map to your area of interest; you’ll then get a list of up to 1000 datasets that are relevant to that area:

Continue reading ‘Harvard Geospatial Library’