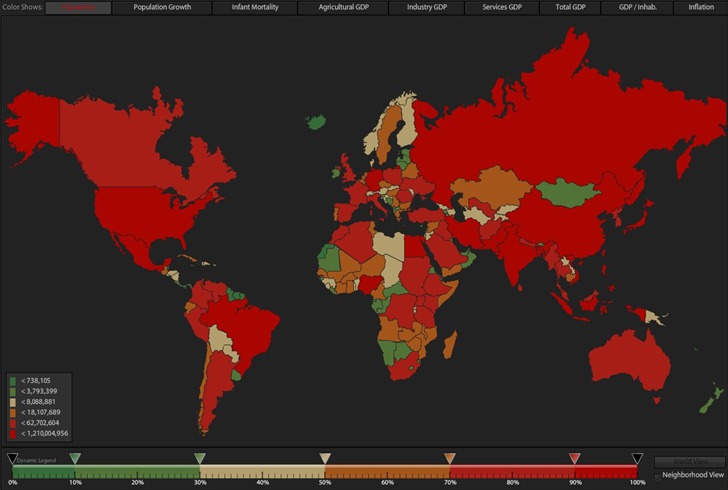
A very slick Flash visualization of CIA world geographic/economic/demographic data called the World Factbook Dashboard; it’s in Flash, so iPad users are out of luck. ;-). Start out with a map of the world, with colors denoting country population:

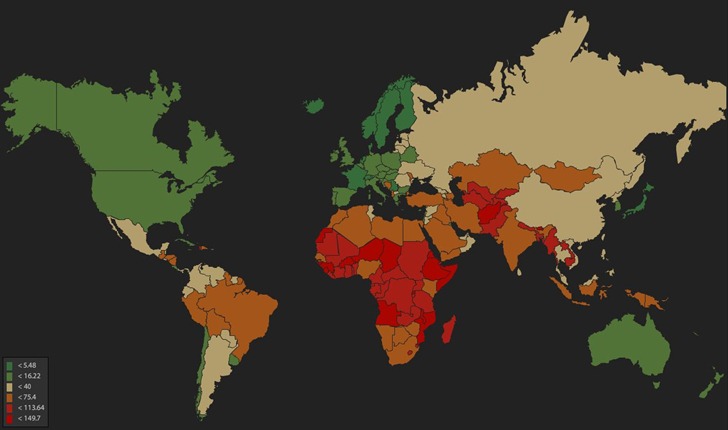
You can adjust color for population ranges by moving the sliders at the bottom; plot a different index by clicking its name at the top, like infant mortality:

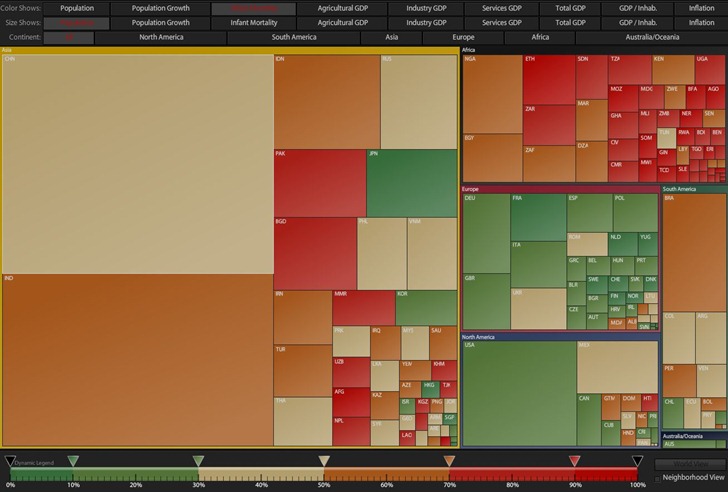
Plot multiple characteristics by clicking on the Treemap tab at top to get a “cartogram”-like view, like this plot where size is proportional to population, and color denotes infant mortality:

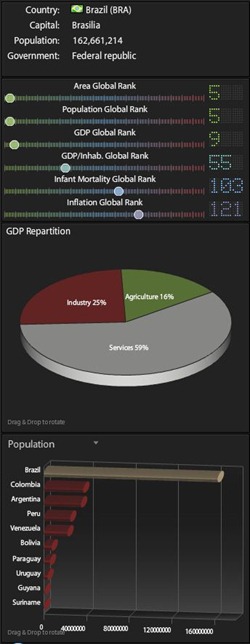
Click on a country in World Map or Treemap mode, and get its worldwide ranking for various parameters, as well as graphic comparisons to neighboring countries for selectable parameters, in a pane at left:

Lots more stuff to check out. Via Download Squad, which has a ten-minute video demoing some of its features.
There’s also http://kmlfactbook.org – where you can visualize the CIA World Factbook data using the Google Earth plugin.
Yup, also a cool site – posted about the kmlfactbook a while ago:
https://freegeographytools.com/2009/kmlfactbook-the-cia-world-factbook-in-google-earth-format