blankblank blank


Archive for the 'cartography' Category Page 10 of 14


Evaluating Map Graphics For Color-Blind Viewers

Via Vector One, I discovered Kelso’s Corner, a blog by an award-winning cartographer for the Washington Post; it’s been added to my blogroll at left. In turn, that blog pointed me to Color Oracle, a free Java tool (Windows, Linux and Mac) for evaluating the effects of several kinds of color blindness. I was surprised to learn that 8% of the male population suffers from some variety of color blindness (that’s about 1 out 12), so keeping their limitations in mind is important. Run the program, and it lets you choose between the three most common kinds of color-blindness: Deuteronapia (most common), Protanopia (rare) and Tritanopia (very rare). It changes the coloring of the entire monitor to reflect what it would look like if you had that specific kind of color blindness, and plasters a big label on the screen to let you know which kind of color blindness is being simulated. Click anywhere on the screen to return to normal color. The program also lets you get a screen capture of the color-blind view.

Continue reading ‘Evaluating Map Graphics For Color-Blind Viewers’


Physical Map Of The World

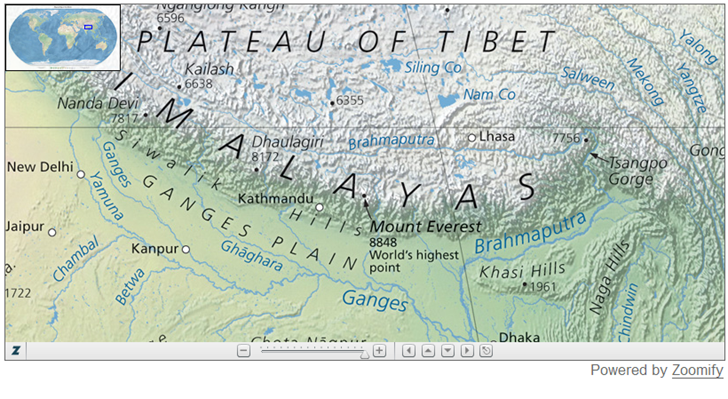
I’ve posted previously about Tom Patterson’s shaded relief maps, and he has a new one out. The Physical Map Of The World extends out his earlier Physical Map Of The Coterminous United States to cover the entire globe with shaded relief topography, “natural” colors to represent biomes, and key physical features labeled:

himalaya

You can view the imagery online in a Zoomify interface, but as with his other imagery, he also provides free downloadable versions of this imagery in CMYK JPEG, and Adobe Illustrator files with the labels and graticule.

Via the always excellent Map Room.


Embed Synchronized Google/Microsoft Virtual Earth Maps On Your Website/Blog

Now this is pretty slick! Go to this link at the MapChannels website, choose a location with the Google Maps interface, fill out a simple form, select some basic options, and get embeddable code that lets you display the same location in both Google Maps and Microsoft Virtual Earth Maps, side by side. Scroll/zoom one side, and the other follows automatically; you can also change the view (Map/Satellite/Terrain for Google, Road/Aerial/Hybrid/Bird’s Eye for Microsoft) independently for each side. Try it out here: Map Channels – Free mapping tools for your website or blog


Historical Nautical And Civil War Maps

The US Government’s National Oceanic And Atmospheric Administration (NOAA) has placed online 21,000 maps, downloadable in both JPG and MRSID high-resolution formats (see this post for several free MRSID viewers and converters). The maps are mainly historical nautical maps dating from 1655 to 2001, but there are also a fair number of Civil War battlefield maps, many of them contemporary with the war, and not all of them nautical in nature.

Continue reading ‘Historical Nautical And Civil War Maps’


Reproject NOAA BSB Raster Navigation Charts And Export Them In TIFF Format

Yesterday, I posted about a NOAA site where you can download Raster Navigation Charts (RNC), maps of coastal and inland waterways. The charts are currently only available in BSB format, which many GIS programs can’t handle; I linked to a few free viewers that will let you view the maps, but not export them. They’re also only available in the Mercator NAD83 projection/datum. Peter Guth (the author of the terrain analysis GIS MicroDEM) let me know about a free utility available from NOAA called the Digital NOAA Nautical Chart Reprojector. It lets you re-project the BSB maps into one of 32 projections (e.g. geographic or UTM) and over 100 datums, then exports the chart in BSB, RAW or TIFF format with a world file; the latter virtually every GIS program and graphics editor can open. It looks like it was originally a command-line utility, since a DOS box pops up when you run the program, but it now comes with a GUI:

NOAA Chart Reprojector

The Input File and Output File dialog windows are a bit clumsy to use until you figure them out, but for the input file, you’re looking for the .kap file that came with the zip file you downloaded from the NOAA mapsite. Choose the desired output parameters at right, including choice of output file format (TIFF here), projection (UTM) and datum (WGS_84). The GUI doesn’t set the UTM zone automatically, but you’ll see the West and East Bounds for the map in the Input Info window at left, and can use those as a guide for setting the correct UTM zone with the Projection Parameters dropdown at right. In this case, clicking “Run” will create the TIF file specified as the output file, along with its worldfile. The file extension for that worldfile will be .tifw; if your GIS program doesn’t accept that, try changing it to the more-commonly seen .tfw extension.

NOAA also has a free extension called Chart Viewer that lets you open BSB charts natively in ESRI’s ArcView and ArcGIS, and Leica Geosystems’ Imagine.


Downloadable Updated NOAA Raster Navigation Charts

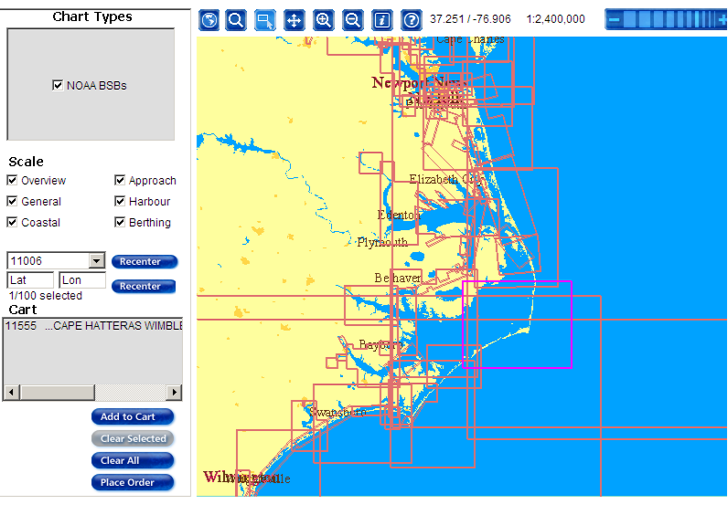
NOAA’s Office Of Coast Survey has downloadable copies of regularly-updated RNCs (Raster Navigation Charts). The updated charts are in BSB format, not supported by many GIS and graphic software programs, but there’s a list of links to free and demo software packages capable of displaying BSB files in georeferenced format (like Caris EasyView and GPSNavX). The site indicates that NOAA will issue GeoTiff versions of these charts at some unspecified point in the future, but those charts will not be as regularly updated as the BSB charts will. Selection is either by chart number or a graphical viewer (requires Java):

bsbgraphicalviewer

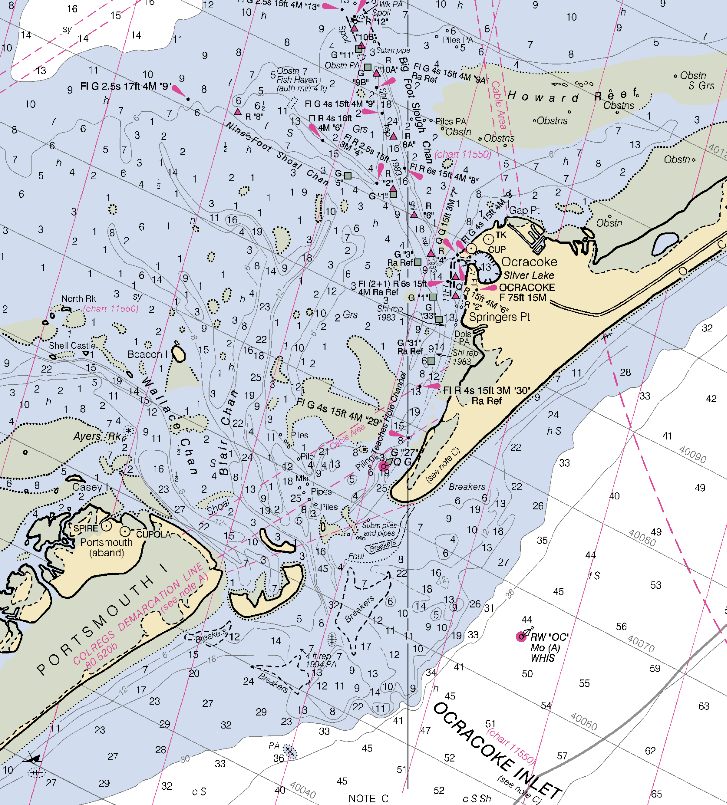
To choose a chart for downloading in the graphical viewer, click the “Selection Mode” button at the top, then click on the rectangle defining the chart area (clicking inside the rectangle does nothing). Click “Add To Cart” at left, which adds it to a list of charts to be downloaded. When you’re done selecting charts, click on “Place Order”, and follow the directions to get a zipped copy of the BSB chart (response time to the button-pushing may be slow):

bsbfull

Native map projection for the georeferencing is Mercator NAD83, in meters.


More Color Design Resources

A few more links to online resources to help with choosing colors for maps and related graphics:

Color.org – Upload your own graphic image, then select colors from it by moving your cursor over the graphic and clicking on a color block. Add colors to a color scheme, or find complementary colors. Interface is a bit confusing, though, and there’s no help file.

ColorSchemer – Click on a single color, or enter the RGB/Hex value, and get a set of 16 complementary colors.

Whatsitscolor – “Whats its color is an image-color processing utility that will evaluate an image and give you the image’s primary and complementary dominant colors of an image, how many visually unique colors are in an image, and the top ten visually unique colors in an image. Extremely useful when creating any type of designs around an image. The more colorful the image, the better the results. Results will display your image on the best suited background for that image.”

See some of the other posts on this blog about color tools (1, 2, 3).

Via Lifehacker.


Recoloring Or Modifying GeoTiff Images

I’ve been posting about various ways to extract and embed geographic metadata from GeoTiffs, image files that have coordinate information in them that can be used by GIS software to georeference the image, i.e. assigning a geographic location to each pixel. Here’s an example of how extracting geographic metadata (like a worldfile) from a GeoTiff might be useful.

USGS 1:24K topo maps are freely available on the Internet from a variety of locations, like LibreMap or the USGS Seamless Server. Maps of forested areas often include green shading to indicate the presence of tree vegetation, but this coloration has always struck me as inaccurate, superfluous, and interfering with reading more critical map features. The US Forest Service apparently feels the same way, as they have removed that green coloring from their updated versions of these topo maps. But if you have a digital topo map with this coloration, it’s possible to get rid of it without losing the geographic metadata.

I’ll start with the USGS 1:24K topo map of Kendrick Peak in Arizona, available here among other locations. This map has a large amount of green shading on it, which was arbitrary to begin with, and is now unfortunately out-of-date because of a serious fire a few years ago:
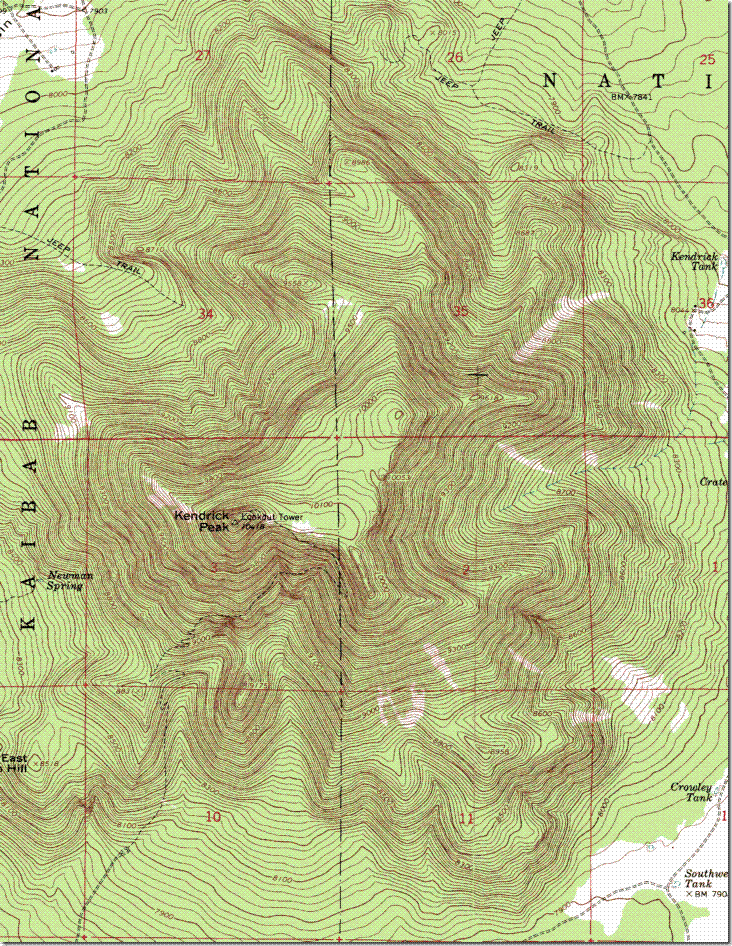
original

If I open this map in virtually any editor and save it, the geographic metadata will be lost. So the first step is to extract and save the full metadata using the libgeoGUI along with the libgeotiff utilities. Next, I’ll open it up in Photoshop Elements. Yes, Photoshop isn’t a “free geography tool”, but Photoshop Elements is a lot cheaper than the full version while still containing much of its functionality. If you look around on eBay or Google, you can often find a brand-new copy of an older version of Photoshop Elements very cheaply, $20-30. And it’s a useful tool to have for general image manipulation, including the purpose I’ll be describing here.

To keep the filesize down, USGS GeoTiff topo maps are often saved in “indexed color” mode, where there’s a limited palette of colors assigned to each byte of pixel information. If it is indexed, Photoshop will show “(Index)” at the top of the image window; if you go to Image => Mode, “Indexed Color” will be checked as well. As long as we’re in Image=>, I’ll select “Color Table”:
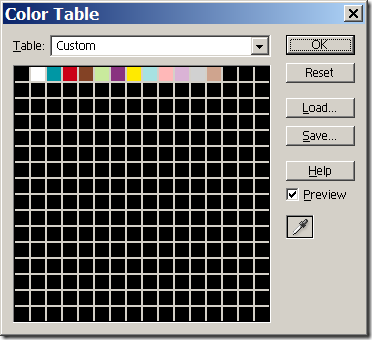
colortable

This shows the full palette of colors used in this topo map, only 13 in this case. If I double-click on the green, the color I want to get rid of, the color picker comes up:
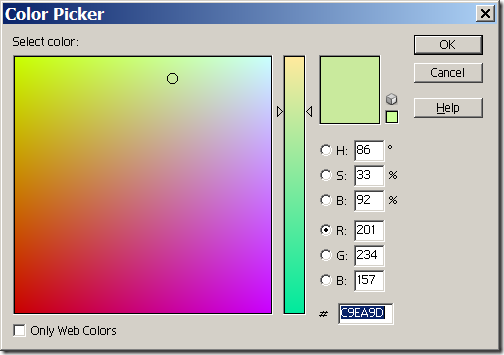
colorpicker

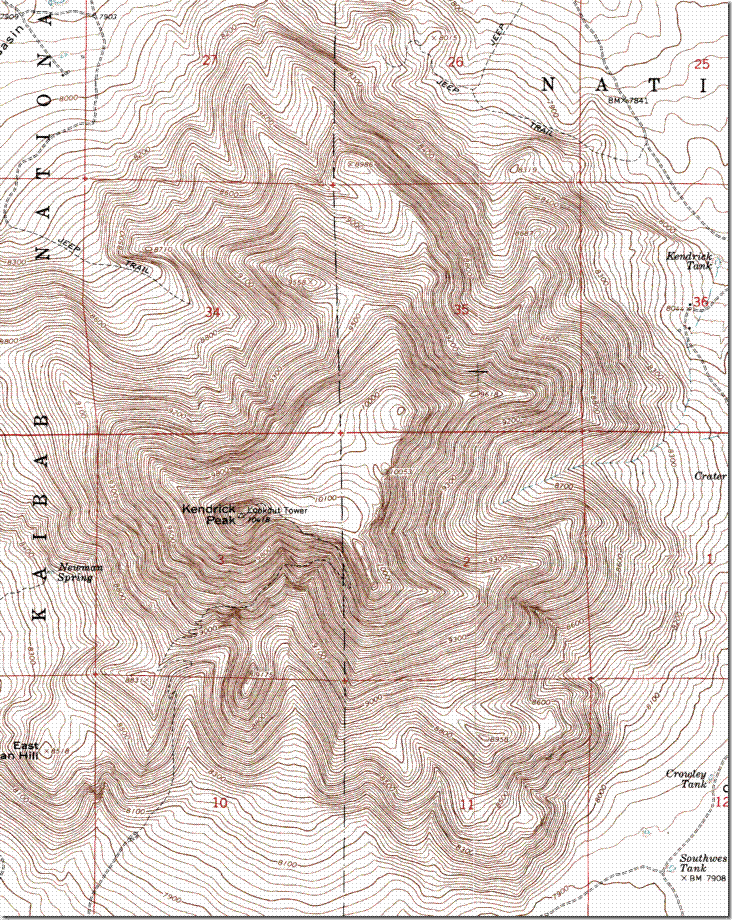
This lets me modify that index color to whatever I want; in this case, setting R, G and B to 255 will turn everything colored green in the original to white. If I now save the newly-modified image as a TIF with a different name, the map area from above, with lots of green, will now look like this:
mod

All the green has been transformed to white, while all the other colors were unaffected. One could have at the same time modified any of the other colors to white to make them disappear, or modified them to a different shade. If you create a modified color scheme you plan to use again, you can save that palette using the “Save” button in the Color Table window.

For images with standard RGB color instead of indexed color, you can use the “Replace Color” function (Enhance => Adjust Color => Replace Color) to perform a similar function.

Opening and saving the map image in Photoshop removes the geographic metadata, but as long as you don’t resize the image, you can use the metadata of the original image to convert this modified image into a GeoTiff. In libgeoGUI, specify the .gtf metadata file created in the first step as the input worldfile, specify the modified Tiff image with the green removed as the input Tiff, and enter a name for the output GeoTiff. Click the “Embed” button, and you now have a GeoTiff with the same geographic metadata as the original, but modified to remove the green. And this approach will work not just with color modifications; as long as you don’t resize the image, you can modify it any way you want, drawing lines and shapes, putting other images on top of it, etc., and then embed the metadata into the saved image when you’re done.