I’ve covered ColorBrewer, an application for assessing color schemes for maps, in a previous post. In the same spirit comes TypeBrewer, an online application that “offers a quick and easy way to explore typographic alternatives and see the impact that various elements of type have on the overall look and feel of a map”. It doesn’t actually design a map, but rather shows you how different fonts and styles appear on a sample map. Select a set of sample font types from the initial choices:
Continue reading ‘Assessing Map Font Styles With TypeBrewer’
The Nearby.org.uk site has a pair of replacement compass indicators for Google Earth:
The Compass Star replaces the standard Google Earth compass indicator:

with one that has an angular degree scale, and finer divisions:
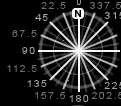
The Magnetic Compass is supposed to do something similar, but this time displaying the direction of magnetic north at any location:

… but sometimes it doesn’t seem to work right.
NOAA has a website that will give you the magnetic declination (the deviation between true and magnetic north) for the present, or any date after 1900, for the entire world. For the US, there’s also a page that gives you that value for dates before 1900. Links to graphic maps of declination and other info are available here.
Martin Feuchtwanger of Underhill Geomatics writes of their surveying utility program Copan. I don’t know much about surveying, but can at least list some features from the help file:
COGO Calculations
Multiple Inverse Calculations
Field Data Processing
Field Azimuths Data Processing
Resection Processing
Map Traverses
Map Checks
Area and Perimeter Calculations
Coordinate Transformations
Traverse Processing
Azimuth Expressions
Distance or Offset Expressions
Shift Expressions
Point Renumbering or Replacement
Supports Geodimeter, Leica, Wild, Nikon and TDS total station formats
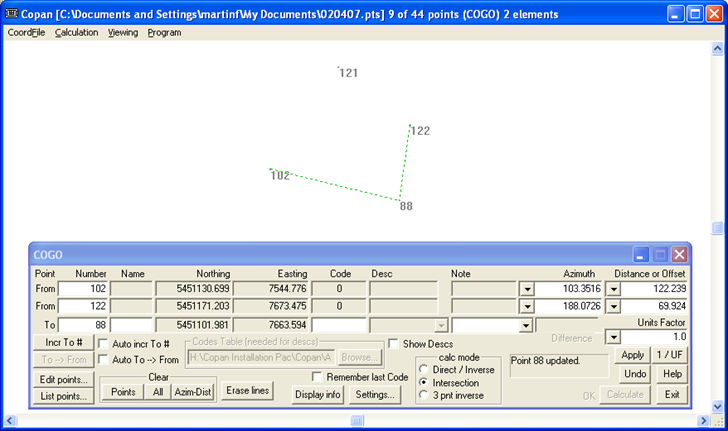
And more …Copan comes in versions for Windows:
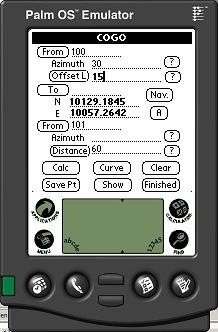
Palm:
And Pocket PC:
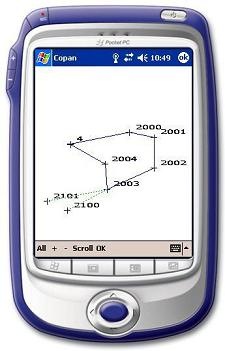
Feature sets are similar between the different versions, and data can be interchanged between them; GPS is supported for the mobile platforms. The software is free, but you’ll need to get a password and license key via email to use any of the versions. The Windows license key is in a “.bin” file, and some email services (like GMail) won’t accept files with that extension.
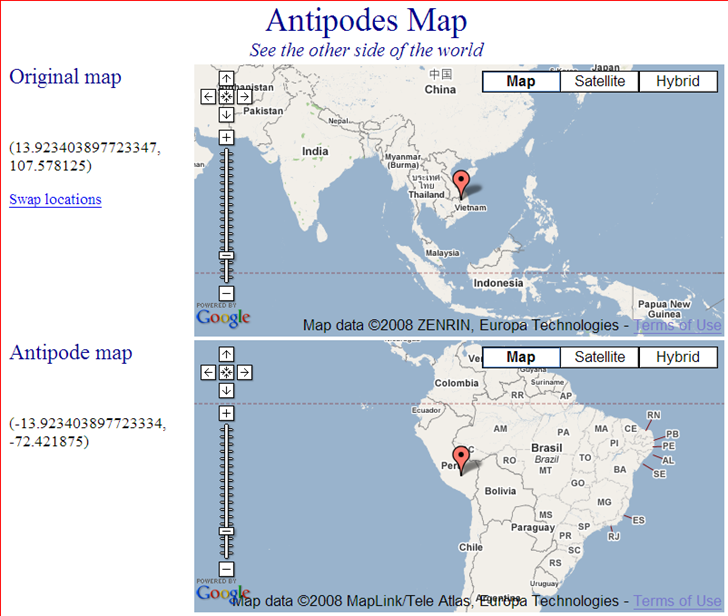
Antipodes Map is as simple a web map as you might want – double-click on a point in the top Google Maps display (or drag the map so that the marker is under the point you want), and a corresponding marker on the exact opposite location in the world (the “antipodes”, or “antipodal location”) will be placed in the bottom Google Maps display. Moving the bottom marker or display has no effect.
Gazetteers are listings of the names, types, and coordinates of both natural and man-made objects. For the US, the US Geological Survey’s Geographical Names Information Service (GNIS) contains name, feature type and position information for over two million geographic features in the US. Feature classes include both man-made (populated place, bridge, canal, etc.) as well as natural features (arch, spring, arroyo, woods). There are a number of similar databases for the rest of the world, like the NGA’s GNS Server, and the GeoNames site.
Another gazetteer website worth a look is SatelliteViews.Net. For geographical subdivisions, they have the US broken down by state, and the rest of the world by country. Select a state or country, then select the type of geographical feature you’re looking for, and get an alphabetical listing of them for that particular region. Select a specific feature, and you’ll get both the coordinates and a Google Maps display with the feature location plotted.
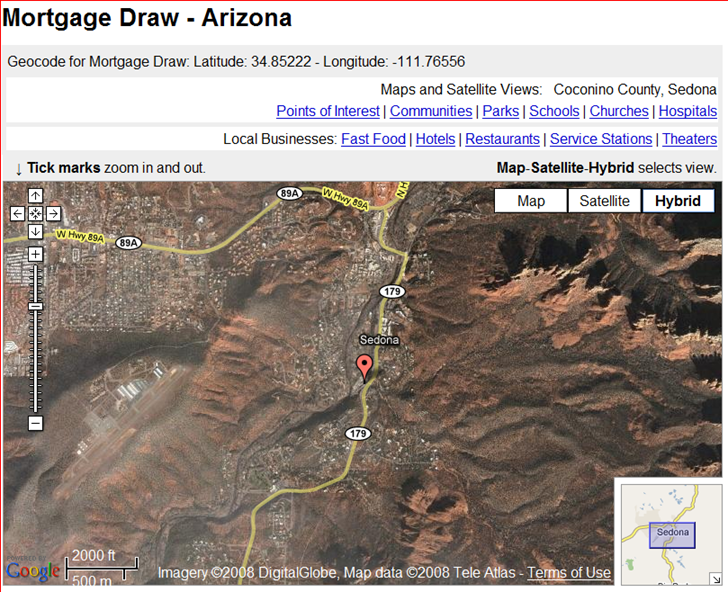
They claim to have 5.9 million worldwide geographic features indexed and linked.
Hat tip to Coy0tea (JG).
The Mapping History site (from the University of Oregon and Universitat Munster) has dozens of static and animated maps illustrating US, European and Latin American history. Examples include “Cotton Production In The South: 1790-1860”; “Peasant Rebellions In Early Modern Europe”; and changes in the political status of South American countries. Some of the animated maps are slider-based (with a play button), and it’s obvious how they work. For other Flash-based maps, you’ll have to click on the map and select “Start” to begin the animation, and select “Key” to bring up the map legend.
If you need a quick rundown of basic information about any country, the World Gazetteer is one option. From the site’s homepage:
- Current population figures and area size for all countries and important territories
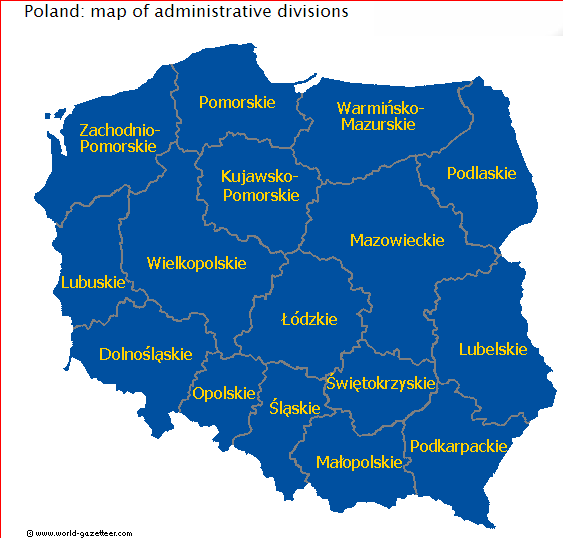
- Population figures and area size of administrative divisions
- Population figures for the largest cities, towns and places as well as for metropolitan areas
- Historical population data (census or estimates; mostly from last or last two censuses)
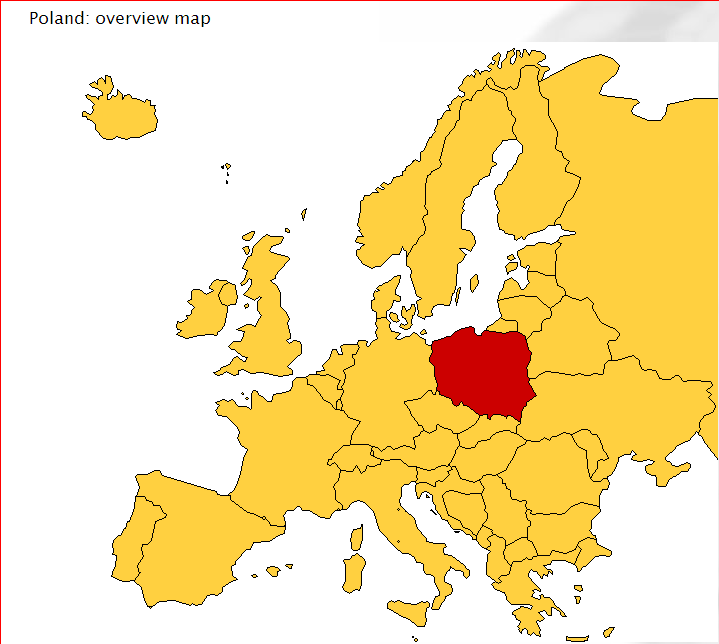
- Overview maps that show the position of the country or the administrative divisions
- Summary statistics for countries and territories as well as for the largest cities and agglomerations
- Current national flags
- Summary maps for various subject
- A pronunciation guide for some languages
- There is a downloadable file for offline research
- A population clock that show the current population of the world
- Comprehensive meta information about statistics and the project
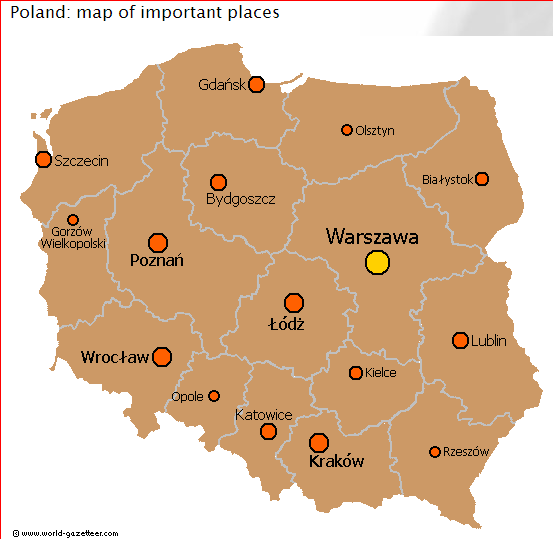
Sample maps from the website (for Poland):
If you regularly work with bearing and distance from a coordinate position, you might find Forward/Inverse from Mentor Software a useful tool. Just enter the starting position (latitude/longitude), the bearing and distance to the destination, click Calculate, and get the coordinates of the destination:
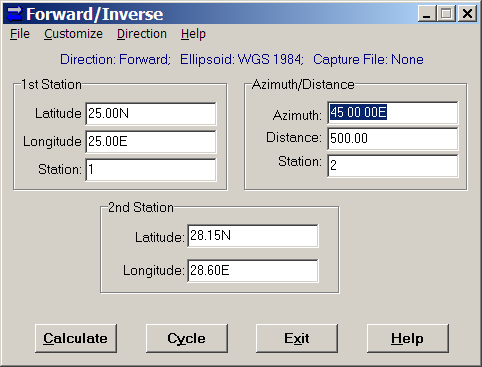
In this example, the distance is in kilometers, and the bearing in degrees, but you can customize those units: degrees or grads for angle, and a full range of English and metric units for distance. You have the choice of 26 different ellipsoids, and a selectable lat/long format (decimal degrees, DM, DMS).
You can also capture the results in a text file, useful if you have a list of them to calculate. The Cycle option is especially useful in such a case, as it puts the destination coordinates (2nd Station) automatically into the origin coordinates (1st Station). So, you can continually input azimuths and distances, calculate the next destination, make that the new “1st Station” with the Cycle button, and capture all the data for all points in a text file. Finally, if you choose “Inverse” under the Direction menu, you can calculate the azimuth and distance from the 1st station to the second one.

