

3DEM ostensibly comes with a number of GPS interface capabilities, including the ability to download waypoints, routes, and tracks, and upload waypoints created in the program. I say ostensibly because I could only get one of the features to work with my Garmin 60Cx, downloading tracks; maybe you might be able to get more to work with your GPS model. But even that one feature allows you to do something more than just display the track on top of a terrain image: it lets you see the elevation profile for the entire track.
Author Archive for Leszek Pawlowicz Page 68 of 79
Google Earth Blog posts on Google Maps new “My Maps” feature, which adds additional editing tools to Google Maps and lets you export the created features into a Google Earth layer. Well worth a look.
At one time, Virtual Reality Markup Language (VRML) was going to be the next big thing on the Web; fully-interactive 3D environments were going to change the way we interacted with the Internet, and our computers. Didn’t quite work out that way – most people were on dial-up back then, which was too slow to make VRML practical. Even after broadband became more prevalent, it turned out that most people didn’t really want to interact with their computers that way. For displaying maps in an interactive 3D environment, Google Earth, World Wind, and other similar programs have pretty much supplanted VRML. But there may still be a place for it in some applications: you can use higher-resolution terrain than what’s currently available in Google Earth/WorldWind along with your own image overlays, the computing requirements are reduced, and the filesize for VRML worlds is usually pretty small. And you can get both stand-alone VRML viewers and browser plug-ins for multiple platforms for free.
3DEM makes creating a VRML world easy. From yesterday’s post, if you’re in a “Foreground” terrain view:
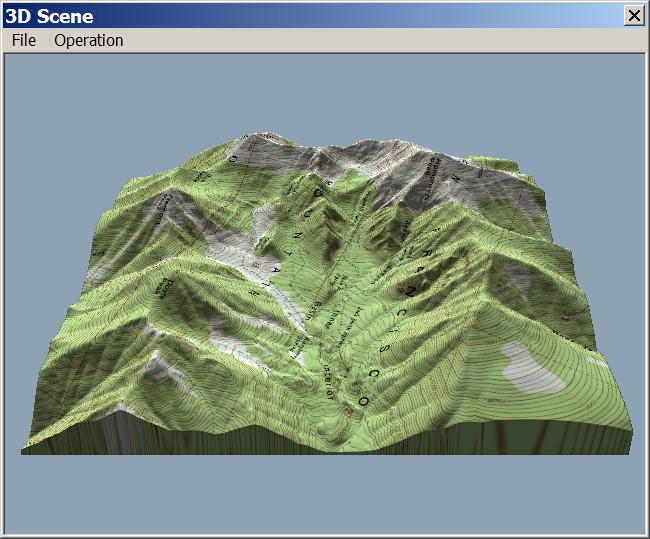
Select choose File=> Save VRML World; a file save dialog will open asking where you want to save the files. Next, you’ll be asked to specify some additional parameters for your VRML world:
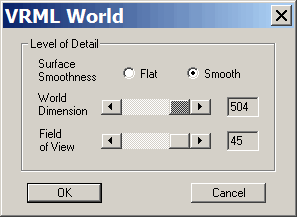
Surface Smoothness and World Dimension set the effective resolution for your VRML world. Flat is less detailed than Smooth, and creates a smaller file size, but given the speed of modern computers, there’s little reason not to set Surface Smoothness and World Dimension to their maximum. Click OK, and two files will be created: an *.wrl file, which contains the terrain data, and a *.jpg file that contains the image data that overlays the terrain. You’ll need to keep both files together in the same folder when viewing the VRML world
To view the result, you’ll need a VRML viewer. Here’s a screenshot from GLView:
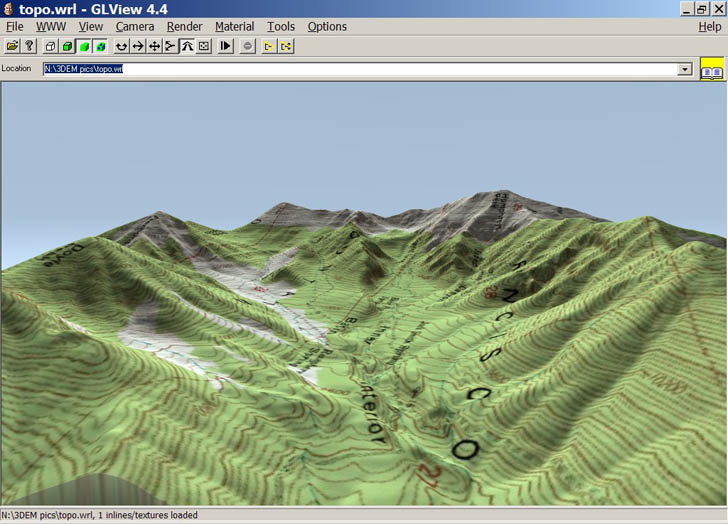
Using the controls in this program, I can walk or fly around the terrain, zoom in and out, change my viewing angle and altitude, take snapshots, and so on.
GLView is the best VRML viewer I’ve seen, but unfortunately it’s no longer available for public distribution. But there’s a good VRML browser plug-in called Cortona available for free from Parallel Graphics. There’s also a stand-alone VRML viewer available from Octaga, but I haven’t actually tried that one myself.
The previous three posts on 3DEM have dealt with its capabilities on 2-D display of three-dimensional surfaces. But it’s also capable of producing three-dimensional images and animations. Not just standard perspective views, but a variety of animated and interactive views, both in standard and 3-D anaglyphic (red/blue) formats.
Doc Savage’s Old Word Archaeology website (great name!) has links to maps aerial/satellite photos, and vector data for most of Israel and Jordan, with some data for surrounding areas (mainly Syria and the Sinai); click on the links under “Digital Data” on the right. Most of the data is georeferenced for direct use in GIS software. Data includes:
- 1:50K topo maps; sources are US and Soviet military topos, and Arabic topos. See this post for more info on Soviet military topo maps.
- Landsat 28m resolution imagery
- NIMA-SPOT 10m panchromatic (black and white) imagery
- Digital Chart Of The World (DCW) data by country, including topography (hypsography), populated places, land use/land cover, transportation, drainages, cultural places, utility lines, and airports. This data dates from the early 1990s (essentially VMAP0), but is still useful. This vector data is in ArcInfo coverages; see this post for info on how to convert ArcInfo coverages into shapefiles.
Global warming is predicted to increase the sea level by:
- About a meter over the next century in the best case (IPCC)
- 5 meters if the rate of sea level rise continues to accelerate at the same rate it has since 1950 (Hansen)
- As much as 12 meters in the worse case (melting/collapse of the Greenland and West Antarctic ice sheets) (Gore)
There is also reason to believe that it will increase the number and intensity of hurricanes, which in turn increases the likelihood of coastal flooding due to storm surges, wind and low pressure combining to drive ocean waters inland. And changes in weather patterns may result in increased flooding events. You can take a look at the potential effect of these events using 3DEM.
Continue reading ‘Sea Level Rise, Storm Surge, And Flooding Effects Using 3DEM’
A while back, I posted on an NOAA website that mapped carbon dioxide concentrations and emissions globally and locally. The Green Car Congress website has posted about a new resource that has maps of both emissions and sequestration, real and potential, for the US and Canada.
One site linked to has PDFs of the printable version of the Carbon Sequestration Atlas of the United States and Canada. The NatCarb site links to maps, static and interactive, showing both the sources and potential sinks/sequestration sites for carbon dioxide.
If you love maps, you have to see the Strange Maps blog. Unusual, historical, fictional, gastronomical, delusional, exceptional, etceteral maps, with excellent accompanying posts (and great comment sections as well).