Global warming is predicted to increase the sea level by:
- About a meter over the next century in the best case (IPCC)
- 5 meters if the rate of sea level rise continues to accelerate at the same rate it has since 1950 (Hansen)
- As much as 12 meters in the worse case (melting/collapse of the Greenland and West Antarctic ice sheets) (Gore)
There is also reason to believe that it will increase the number and intensity of hurricanes, which in turn increases the likelihood of coastal flooding due to storm surges, wind and low pressure combining to drive ocean waters inland. And changes in weather patterns may result in increased flooding events. You can take a look at the potential effect of these events using 3DEM.
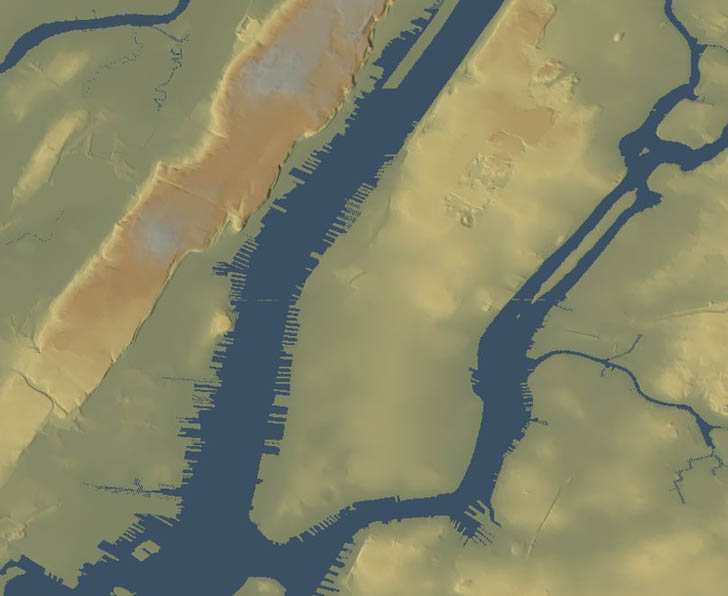
First, load a digital elevation model (DEM) of the area you’re interested in into 3DEM, from the USGS Seamless Server or other source. The picture below shows a shot of Lower Manhattan and the surrounding areas using a 10-meter resolution NED DEM from the Seamless Server (click on the picture for an enlarged view):
Open the Terrain Colors dialog (Color Scale => Modify Scale):
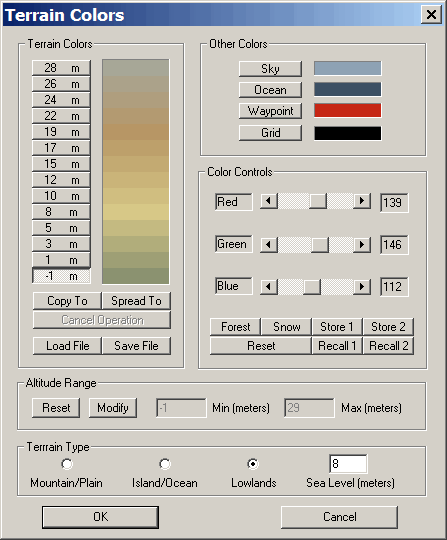
At the bottom, make sure that “Lowlands” or “Island/Ocean” is selected. Now enter the increase in sea level in meters into the box at the lower right (1 meter is about 3.25 feet). For this example, we’ll take a look at the effect of a 8-meter hurricane storm surge on the Manhattan area, well within the realm of possibility:
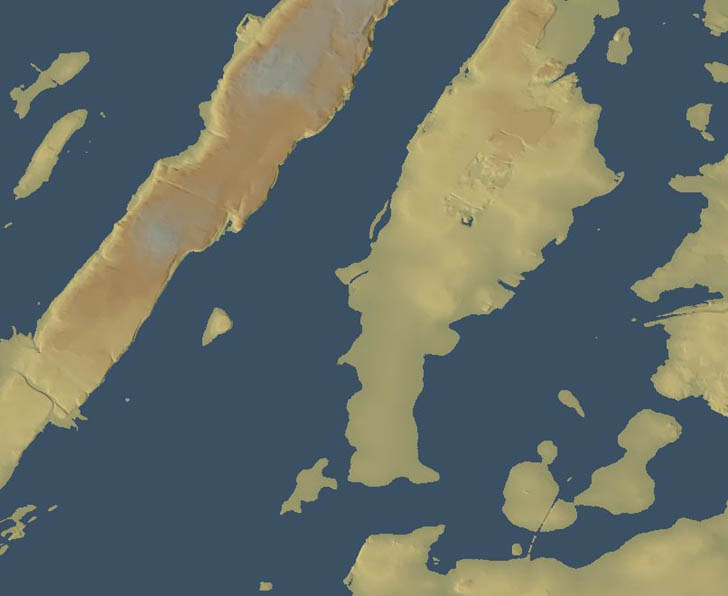
As you can see, a good part of lower Manhattan and the surrounding areas disappears under water in such an event. That’s why some insurance companies have stopped writing new homeowner policies in parts of the New York area. For comparison, here’s an image from the Flood Maps website, that shows the effect of an 8-meter sea level rise on coastlines:
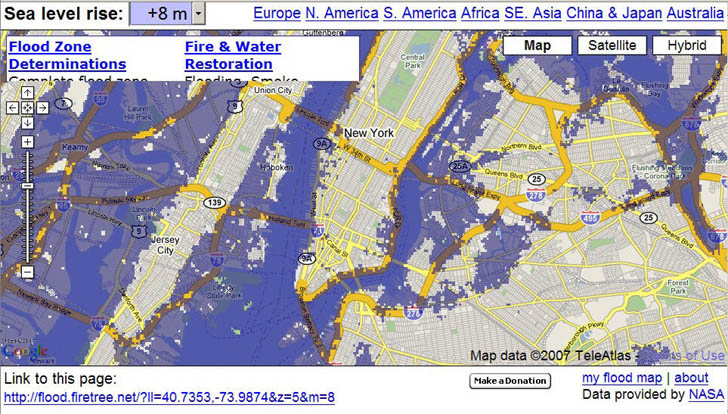
The Flood Maps website uses Shuttle Radar Topography Mission (SRTM) data, which includes the altitude of buildings as well as the land, averages over a 90-meter resolution, and likely has lower accuracy as well. As a result, the Flood Maps image underestimates the amount of flooding that will occur over a built-up urban area on the coast. Errors might also occur over areas that have extensive vegetation cover, like tall trees. The NED DEM data from the USGS Seamless Server has elevations from the land only, not the buildings or trees, so in this case it’s more accurate.
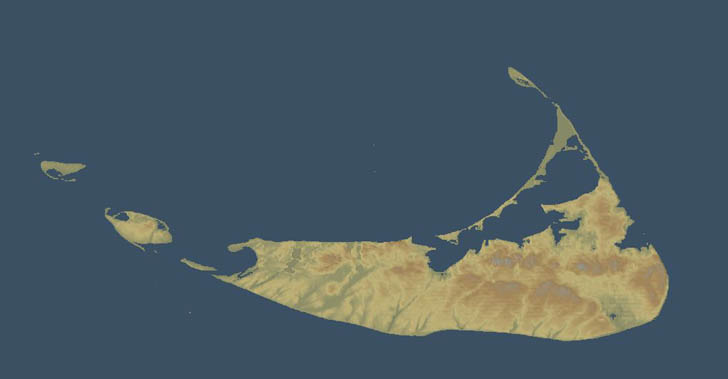
For another example, let’s look at Nantucket Island, just south of Cape Cod:
Suppose the worst case global warming events happen, and the sea level rises by 12 meters:
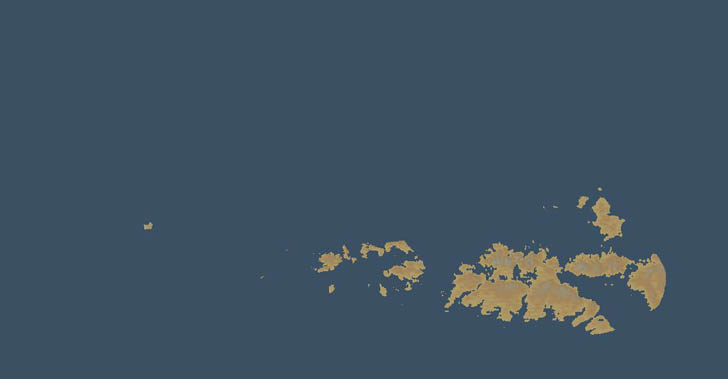
Goodbye, Nantucket.
Compare the picture above with the comparable image from the Flood Maps website:
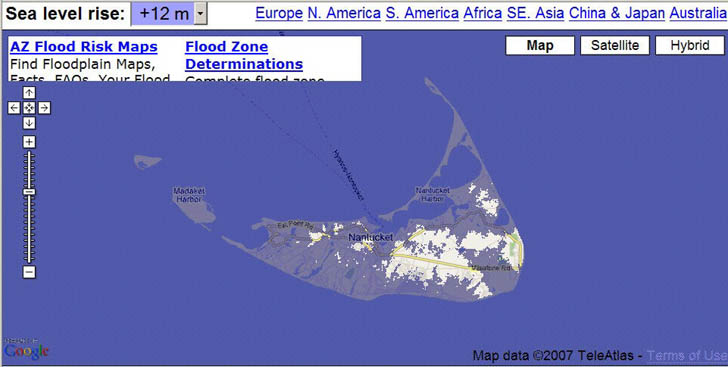
Because Nantucket doesn’t have a lot of buildings or trees on it, the results agree more closely than for the case of Manhattan.
You could also take a look at the effects of river or lake flooding in upland areas using this approach. Find the elevation at the surface of the body of water, add the increased elevation due to flooding to that elevation, and enter that number into the box for “sea level”.
The biggest drawback of this approach is that 3DEM “floods” all areas below sea level, regardless of whether or not such flooding would be blocked by hills, mountains, levees, or other topography. Ideally, you’d want to take that topography into account when flooding; maybe you’d also like to make a movie showing the progress of flooding as the water level rises. Perhaps something like this …
… but that’s a topic for a future post ;-).
Great tool – good for a quick-and-dirty visualization, however water surfaces may have a profile and variable elevations dependent on terrain and other factors.
I tend to be spoiled with a lot of expensive COTS tools, but thank you for sharing these tools and insights!
Yes, it’s very simplistic – it just does a flood fill at constant water elevation, ignoring terrain effects. Even the program I’ll talk about in the future only takes terrain into account, not variations in water height. That’s why they charge the big bucks for COTS software. Still, these programs are free, and to first order they can give you pretty decent results.