blankblank blank


Author Archive for Leszek Pawlowicz Page 59 of 79


Global One-Degree Gridded Economic And Climate Data

From the abstract at the Geographically based Economic data (G-Econ) website:

“The G-Econ data set calculates gross value added at a 1-degree longitude by 1-degree latitude resolution at a global scale for all terrestrial cells. These data allow better integration of economic and environmental data to investigate environmental economics, the impact of global warming, and the role of geophysical factors in economic activity. On of the major results is to show that the true economic deserts of the globe are in Greenland, Antarctica, northern Canada, Alaska, and Siberia.”

Downloadable spreadsheet data includes not just economic data, but also environmental data:

  • Precipitation (monthly)
  • Temperature (monthly)

– Terrain

  • Elevation
  • Roughness
  • Standard deviation of elevation

– Vegetation

– Soil Types

Convert the spreadsheet data to shapefile format, or plot it directly in Google Earth using GE-Graph.

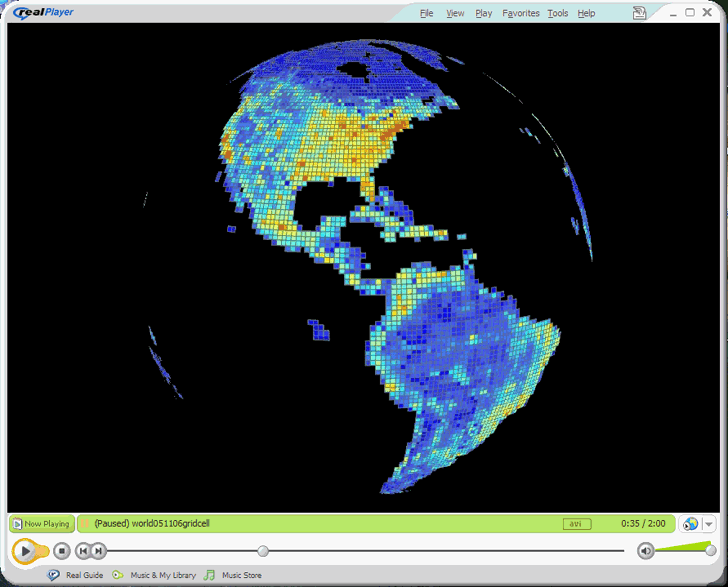
The site also has rotating globe animations with data plotted:

Animated globe with thematic data plotted

Via Vector One.


Mapping Radio Coverage, And Viewing It In Google Earth

JS writes, “I am doing a very small wireless operation in Catalonia, and it would be very interesting to have the coverage map of the antennas. Do you know any free (or cheap) tools to do that and place it on Google Earth?” I know of two free Windows tools useful in analyzing radio coverage. The first one is a general purpose terrain analysis program that will give “quick and dirty” plots of line-of-sight coverage and required antenna heights fairly easily. The second, more sophisticated program is specifically designed for determining broadcast coverage and signal strengths, but is also more difficult to use. Getting the data products into Google Earth can take some work, but can be done.

Continue reading ‘Mapping Radio Coverage, And Viewing It In Google Earth’


Plotting Public Land Survey System Locations In Google Earth

A recent post covered a website with Public Land Survey System (PLSS) shapefiles, and a geocoder that gives the PLSS data for an entered set of coordinates. In the comments, Bill Clark points out his Township And Range website, which links the PLSS data to Google Earth.

You can:

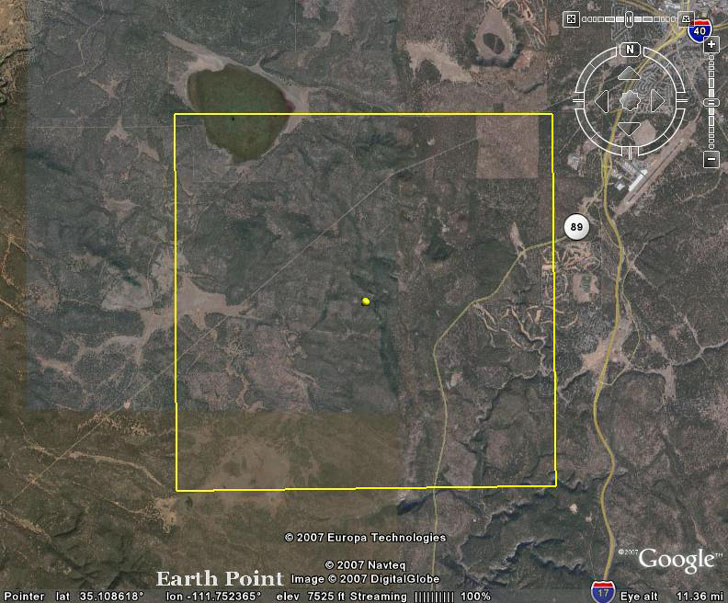
– Enter a State, Principal Meridian, Township and Range, and be flown to that square in Google Earth:

View PLSS Public Land Survey System data in Google Earth

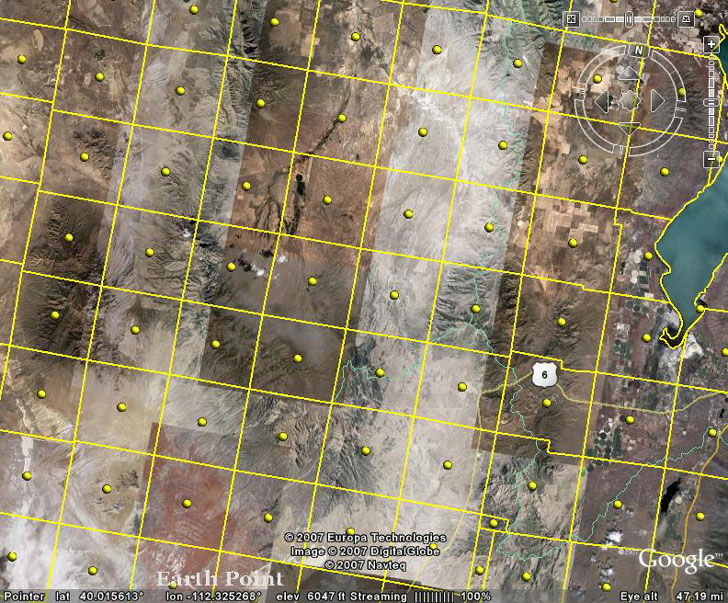
– View National Atlas PLSS data directly on Google Earth (full coverage of the central and western US, but no mile sections, and less accurate than BLM data):

View PLSS Public Land Survey System data in Google Earth

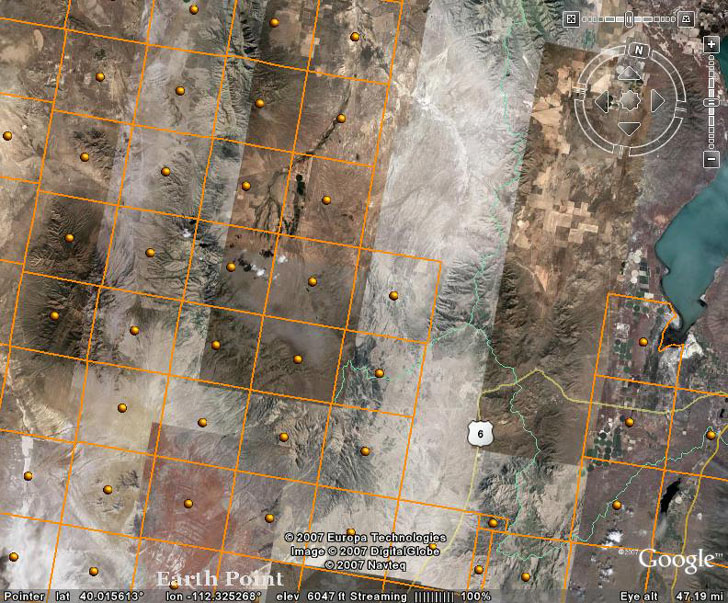
– View BLM PLSS data directly on Google Earth (less coverage than the National Atlas, but more accurate, and shows mile sections):

View PLSS Public Land Survey System data in Google Earth

You have to zoom in to the point that less than 200 townships are visible; the closer you zoom, the smaller the section that become visible. And be patient, it can take several minutes for the data to load in completely. Click on the ball in the center to see the PLSS info for the squares.

Nice job, Bill!


Convert A Google Maps Point To Multiple Text Geographic Formats

There’s a handy Google Maps site that lets you place a marker, gives you the position, and then lets you convert that position into a number of geographic text formats.

Continue reading ‘Convert A Google Maps Point To Multiple Text Geographic Formats’


In-Browser Web Page Image Capture

A good screen capture utility is useful to have for “snapping” images from programs or web pages, e.g. maps from Google Maps. I posted earlier about a couple of general screen capture programs that run in the background, and can capture images from any program. But if you primarily capture images from websites, there are a couple of handy in-browser utilities for both Firefox and Internet Explorer that let you grab and save an image from directly within the browser.

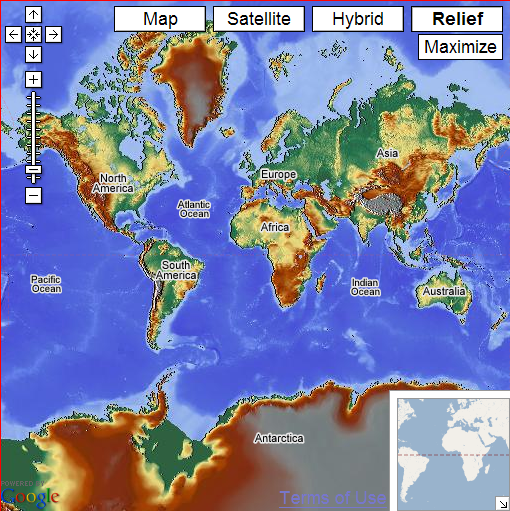
For Firefox, there’s an extension called Snapper. While the page lists it as being compatible only with Firefox 1.5, there’s a version that I’ve tested with Firefox 2.0 available at this page. After installing the extension and re-starting the browser, a small icon of a red fish (red snapper – get it?) appears in the status bar at the bottom of the browser. To capture an image, click once on the fish (its mouth will open), then click and drag on the screen to select the image you want to capture defined by a red box. It will be saved as a .png file in the c:\Capture directory as a default, but you can modify the capture directory using the extension options screen. Here’s a capture from the Google Maps relief shading site posted about earlier this week:

snapper1179010575548

If you’re using Internet Explorer, there’s an “extension” called IE7Pro that adds not just page image capture, but a whole bunch of other features like ad blocking, mouse gestures, crash recovery, advanced tab management and more. Download and install IE7Pro; the next time you open Internet Explorer, you’ll see a blue “e” in the status bar in the lower right-hand corner. To capture an image of the entire web page, including sections that are currently off-screen but scrollable to, right-click on the “e” and select “Save Current Tab To Image”. You’ll be prompted for the location to which to save the image in PNG format. Right-clicking on the “e” also gives you the option of setting other feature options as well. Even if you don’t need the web page image capture feature, the other features makes this a worthwhile download.

Don’t forget that for many images on the web, use is limited by copyright laws.

Via Webware.


Animated Flooding Maps – Storm Surge, Sea Level Rise And River Flooding

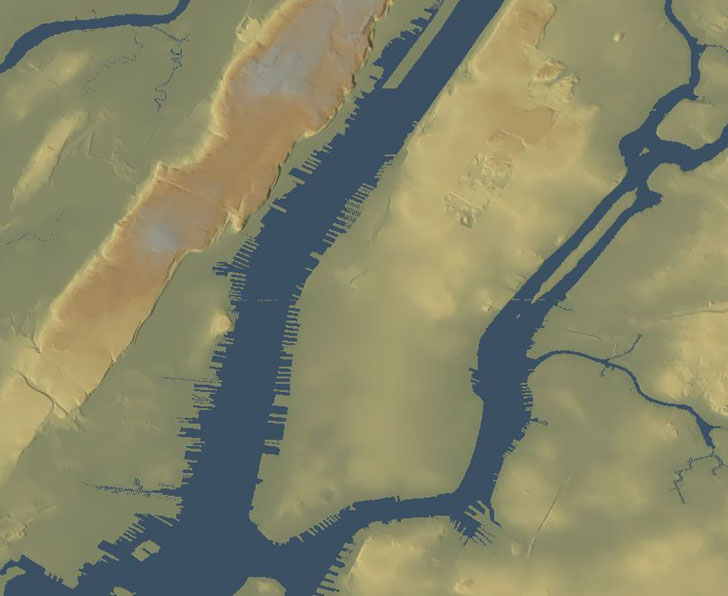
A while back, I did a post on assessing the effects of sea level rise on coastlines using the program 3DEM. Here’s a terrain image of southern Manhattan Island at current sea level:

manhattan

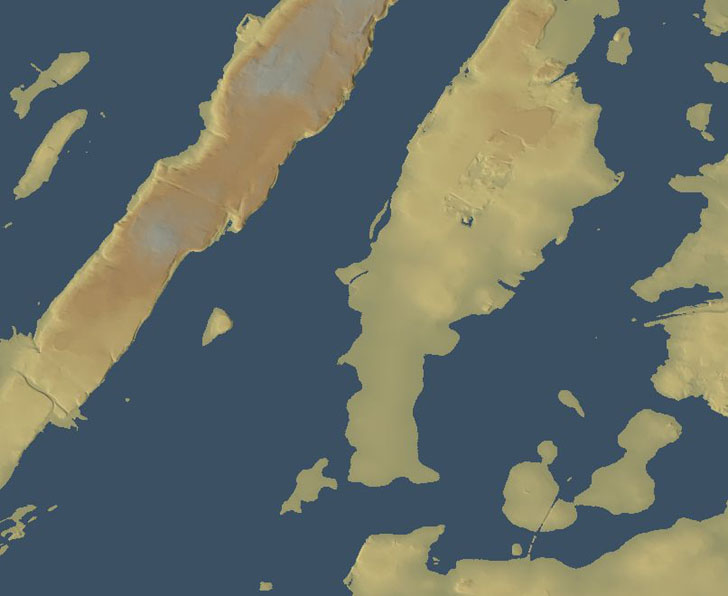
And here’s what it would look like with 8 meters of flooding, due either to a hurricane storm surge or global-warming-induced sea level rise:

Manhattan flooded by eight meter sea level rise

The problem with the latter image is that 3DEM did a basin flood, i.e. it filled in all the terrain that was less than 8 meters below sea level, without taking topography into account. For example, a range of hills could lie between some lowlands and the sea, but 3DEM wouldn’t take that natural dam into account. But I also posted an animated flooding map of the same area that did take that terrain blocking into account (click on the “play” button to view the animation):

Today’s post will show how to create such a flooding animation.

Continue reading ‘Animated Flooding Maps – Storm Surge, Sea Level Rise And River Flooding’


Drawing Lines Between Points In Google Maps, Straight And Great Circle

In comments from a previous post, TommyBoy writes:

“What I’m looking for and just can’t seem to find; is a simple line plotting tool for Googlemaps. On the weather sites, they’ll say “a storm is expected south of so-and-so to so-and-so to so-and-so. I’d like to pop those cities into a GMap, and have is simply display a straight line connection one city to another, so you can see the storm line. Not following roads and directions, just a point to point to point line. I’ve search high and low, and can’t find anything that simplistic. Ever come across something like this?”

Why yes, I have. Of course, if I hadn’t, I wouldn’t be writing this post :).

The RoutePlanner website allows you to plot routes between locations on a Google Maps interface that you define either by clicking on the map, or entering the location into a search box. For drawing a straight line between two cities, you would do the following:

a. Skip the first step the interface, which zooms in on a location of interest – in most cases the zoom will be at too high a level to be useful.

b. Enter the points you want to draw a straight line between, either by clicking on the Google Maps interface, or entering a location (at least city and state) into the search box. When you enter the first point, it will zoom into that location. Entering the second point will not zoom to that location, though, and you will probably want to zoom out to see both markers on the map.

c. You have two sets of options in the third step on the page. The first is supposed to give you the driving route between the two points, but I can’t seem to get it to work (possibly because of pop-up blocking issues). The other draws a “as the crow flies” straight line between the two points, which is what I think you want. There are two options, “Get Crow Route As Entered” and “Get Best Crow Route”, but they usually seem to give the same results for two points. There are times, though, when one of the “Crow” options doesn’t work, while the other does, and that appears to be a problem with clearing out locations from a previous operation.

d. Once you’re done, you can zoom out to see the line between the two locations, clear everything and Start Over, or even save the points and drawn line in a permanent URL you can bookmark, like this one.

One thing to keep in mind, though, is that only North/South and East/West lines will be “true” in terms of direction. I believe Google Maps uses the “Plate Carree” (“flat and square”) or equirectangular projection, where the grid uses an equal spacing for latitude and longitude degrees in the y and x directions. But on the earth, the distance spanned north/south by a degree of latitude is constant, while the distances spanned east/west by a degree of longitude is greatest at the equator and shrinks to zero at the poles. So line drawn on the map that isn’t exactly east/west or north/south doesn’t represent the bearing angle from one point to another correctly, but will be skewed southward somewhat. For the purposes you want to use this for, though, it’s not that big of a deal.

Another thing to remember is that on a flat representation of a curved surface, like a map of the earth, a straight line is usually not the shortest distance between two points. For that, you’d want a “Great Circle” route plotter, and there’s a pretty good one with a Google Maps interface at the Great Circle Mileage Calculator and Display website. Unlike the RoutePlanner website, you have to manually choose the two points you want to draw a Great Circle between, but creating the points is easy:

1. Enter the locations that you want to create a Great Circle between in the box at the top.

2. Click on Start Course

3. Click on the first point marker, then the second, then click “End At Last Point”; the Great Circle Route will be drawn between the two. You can also add markers to the map manually at this stage as well.

The other options are fairly easy to figure out.


Have You Heard Google Earth Lately?

The BBC reports on a project by Wild Sanctuary to add their extensive collection of natural sounds (3500 hour, and 15 thousand different species) as a layer to Google Earth. They’re “in talks with Google, although no official agreement has yet been made”.

PS Make sure you check out the media player at the bottom of the Wild Sanctuary website for examples of their natural sound resources.