blankblank blank


Author Archive for Leszek Pawlowicz Page 18 of 79


Downloading MapQuest, Live Search Results To A Garmin GPS

A while ago, I covered the process of downloading a Google Maps search result to a Garmin GPS, using the Garmin communicator plugin. The Garmin blog has posted videos on how to do the same thing with Microsoft Live Search:

MapQuest:


and Google Maps as well:


You will need to have downloaded and installed the Garmin Communicator plugin first; versions are available for both PC and Mac.


Removing WordPress Cruft

In addition to the Internet connectivity issues I had earlier this month, I got zapped by a major website issue. My hosting service claimed that my WordPress blog had a problem either with its mySQL databases, or with malformed queries that resulted in an abnormally-heavy server load. They said it was so bad that they had to shut down my account completely for about 4 hours on December 23rd to keep the server running. I took a look at the queries, and didn’t see any problems with them, and a brief inspection of the mySQL databases didn’t show anything wrong. But to make sure that was the case, and to keep my hosting company happy, I took a deeper look at my blog to see if there was anything I could do to remove any cruft that had built up in my blogfiles since I switched to WordPress in June 2007. This isn’t exactly geography-related, but I thought that some WordPress users might find a description of what I did useful.

1. First, I de-activated unneeded plugins. I’ve tried numerous plugins in the year-and-a-half since switching to WordPress, and had pretty much already settled on a core group of eight useful plugins. But there were a couple that weren’t completely necessary anymore, and de-activating them was likely to lessen the server load.

2. Next, I backed up the mySQL databases before trying to work with them, in case something got screwed up. Many hosting companies offer access to control panels like phpMyAdmin that lets you do this. But if you don’t have this access, or if it’s too complicated, there’s a free WordPress plugin called WP-DBManager that lets you create DB backups from the WordPress dashboard, and restore them if necessary (along with some other useful functions).

3. When a WordPress site loads, it reads the wp_options database for configuration data for both the basic site, and plugins. There should be no more than a few hundred entries in this table at most, and the bigger it gets, the longer a site takes to load. Here’s the story of one site owner who discovered that there were over 19000 entries in this table, most of them unnecessary RSS hashes; another source of unneeded entries are from plugins that created them when installed, but didn’t remove them when de-activated. There’s a plugin called Clean Options that does a good job of finding most unneeded options entries based on whether there are any active plugins that use them. Running this plugin reduced the number of wp_options entries on my site from 355 to about 250. But it also found an erroneous blank entry, but didn’t offer a way to remove it. Once you’re finished with this plug-in, it’s OK to deactivate it until you need it again.

4. Going into phpMyAdmin and manually browsing the wp_options table, I found and deleted the blank entry. But there were also about 50 additional table entries for deleted plugins that Clean Options hadn’t found, so those were deleted as well.

5. The wp_posts table contains individual entries for all the posts, pages and images on the blog. The total number of entries was 2700, which seemed high since there’s fewer than 600 posts on this blog to date. An examination of the entries by title showed why – there were numerous duplicated title entries for many of the posts. A bit of research turned up the reason. WordPress 2.6 introduced post versioning, which seemed like a good idea to me. But with every revision to a blog post, even a minor tweak, a new database entry was created for that revision. This was making the wp_posts database table grow a lot bigger than it really needed to be.

WordPress knows about this, but decided that the feature was so useful, and the overhead associated with the larger table so minimal, that they didn’t include the option to turn off versioning, nor to delete unneeded versions. Fortunately, there’s a plugin called Disable Revisions that not only disables revision versioning, but deletes all the revision entries in the wp_posts and wp_postmeta tables. Make sure you backup your database first before activating the plugin, as it does the deletion as soon as it’s activated. Installing and running this plugin decreased the table size by about a third, from around 2700 entries to roughly 1800.

6. I also found a number of database tables created by plugins that were no longer present, and dropped those. The default WordPress installation only has 10 database tables:

  • wp_comments
  • wp_links
  • wp_options
  • wp_posts
  • wp_postmeta
  • wp_terms
  • wp_term_relationships
  • wp_term_taxonomy
  • wp_user_meta
  • wp_users

Any other tables were most likely created by plugins. Usually the name is enough to let you figure out which plugin created it, but if not, just Google the table name. If it was created by a plugin that’s no longer installed, you can probably drop it (but always backup first).

7. I then checked and optimized the database tables using phpMyAdmin; the WP-DBManager plugin can do that as well.

8. Finally, I found useful suggestions at this site and this one for speeding up page loading. For example, in the WordPress theme header and footer sections, php code is used to insert web addresses for style sheets, RSS feeds and coding. But these addresses are normally static, and you can speed up the loading process by replacing the php code that pulls up the address with just the address text itself. For example, the original code for specifying the CSS sheet for this blog was:

<link rel=”stylesheet” type=”text/css” media=”screen” href=”<?php bloginfo(‘stylesheet_url’); ?>” />

By opening my blog’s home page, and using the View => Page Source option, I found that the stylesheet’s static URL was

https://freegeographytools.com/wp-content/themes/K2/style.css

Replacing the php code with this static URL, I get:

<link rel=”stylesheet” type=”text/css” media=”screen” href=”https://freegeographytools.com/wp-content/themes/K2/style.css” />
Because the php code doesn’t have to be interpreted to retrieve the URL, the page loads a bit faster for every case where you can do this. I also dropped several unneeded lines of this type, such as the one that retrieves the WordPress version number and inserts it into a meta tag. Getting rid of this not only speedsup page loading, but improves your site’s security. If a security flaw is found in a particular version of WordPress, the version meta tag can tell an intruder instantly whether your site is vulnerable. If the tag is missing, it’s not as obvious whether your site still has this vulnerability or not.

Did all this solve my site problems? Don’t know yet; I’m getting fewer mysql_slow_query log entries, but haven’t gotten rid of them entirely. But I suspect that’s a server-related issue, which I can’t do anything about. I can say that my blog pages load in about half the time they used to in Firefox, and a third of the time in Internet Explorer, so presumably that reflects a reduction in my site’s load on the server.

Hopefully now I’m done with all these issues, and can get back to geographically-oriented posts on a more-normal schedule.


Snow Cover Maps

So, the week of December 15-19, when I was supposed to be out doing field surveys in northern Arizona, we got snow. A lot of snow. And it kept going until about December 26th. It’s kind of hard to do a field survey when the ground is covered with snow, but I’ve been hoping the recent bout of warm weather would melt that snow quickly, and let me get back out in the field.

To monitor that situation, I’ve been consulting the US National Weather Service’s National Operational Hydrological Remote Sensing Center (with the snappy acronym NOHRSC). At this time of year, they supply a large number of snow-related data products, including:

Continue reading ‘Snow Cover Maps’


Battle KML Time Animations For Google Earth

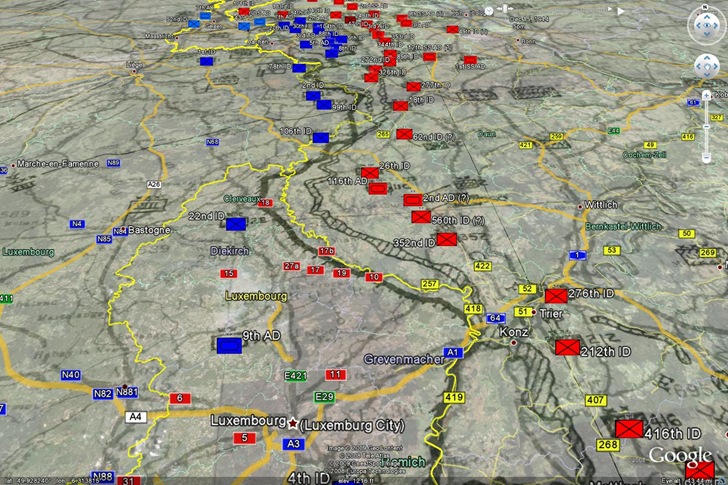
Professor Peter Guth of the US Naval Academy, author of the first-rate terrain analysis and GIS program MicroDEM, writes to let me know that the final projects of one of his classes are available online. Among the projects are KML files for a number of historic battles, including time animations for Antietam, the Battle Of The Bulge, and Dien Bien Phu. These combine both actual historical situation maps as image overlays, and placemarks for unit positions:

Battle Of The Bulge in Google Earth

While you can click the “Play” button on the time animation control, I find it easier to follow the animation by manually moving the time slider over from left to right to follow the progress of the battle.


Google Earth Plus – RIP

Not exactly new information anymore, but a few weeks ago, Google discontinued Google Earth Plus, their $20/year enhanced version of the free Google Earth program. These enhancements included:

  1. Enhanced performance – a faster download speed for data.
  2. Printing – A 40% improvement in printing quality (1400 pixels versus 1000 pixels).
  3. GPS Data Import (read only) – Download waypoint, track and route data directly into GE from a GPS
  4. Real-Time GPS Tracking – Put an icon in Google Earth to mark your current position as measured by a connected GPS.
  5. Spreadsheet data import – Import a .csv file with coordinates into Google Earth, and do address coordinate lookup (geocoding) as well.
  6. Advertisements – Optional in the Plus version.

One of the very first posts I did on this blog was on Google Earth Plus, but in a bit of foreshadowing, it was titled “Google Earth Plus – Do You Really Need It?”. It kicked off a multipart series describing ways you could duplicate, and even exceed, most of the important capabilities of Google Earth Plus using free or inexpensive software. Even though Google has dropped the Plus version, it’s steering people who need its capabilities to the $400 Pro version, which in addition to spreadsheet import allows opening GIS data like shapefiles and georeferenced imagery. I’ve covered programs that mimic some of those functions, like converting shapefiles to KML format, and creating Google Earth image overlays from georeferenced imagery; I’ll be covering some cheap and free options for creating image superoverlays before too long. And while Google says they will add GPS tracking to the free version of Google Earth in the near future, my Google Earth Plus For Free series covers several options available now, and I’ll have a post with two more options soon. For that matter, just take a look through the Google Earth category on this blog for dozens of useful Google Earth data tools that do things that no version of Google Earth can do, like export KML files to GPS receivers.


Tiny Geocoder

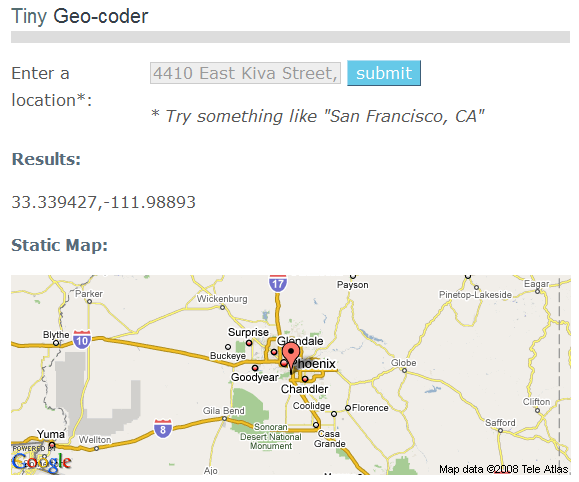
Tiny Geocoder is a small, simple web geocoder; type in an address or geographic location, and get back the approximate latitude/longitude for that location, and a Google Map view with that location plotted:

12-1-2008-10.03.26 AM

If you have a Google Map API key (free), you can generate code to create a static link to this map (static meaning just the image itself, not scrollable or zoomable).

And for web gearheads, there’s a simple and free API available for geocoding and reverse geocoding. Here’s an example of geocoding for Provo, Utah, and reverse geocoding for 37,-110.


Embeddable Visited States/Countries Image

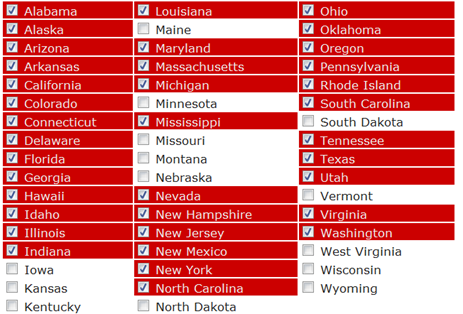
At the Visited Countries site, fill in a checklist for a list of US states, Indian states, or world nations:

12-1-2008-9.07.36 AM

and get back a link to an image you can embed on your website or blog:


visited 36 states (72%)
Create your own visited map of The United States or try another Douwe Osinga project

Guess I need to spend some time in the Plains states :). There’s also a button which leds you embed the map directly into your Facebook page. For a site that creates a similar KML file for Google Earth, try Color Your Map.

Via Cartophilia.


Online Traveling Salesman Problem Solver

Wikipedia defines the “Traveling Salesman Problem” this way:

… given a number of cities and the costs of travelling from any city to any other city, what is the least-cost round-trip route that visits each city exactly once and then returns to the starting city?

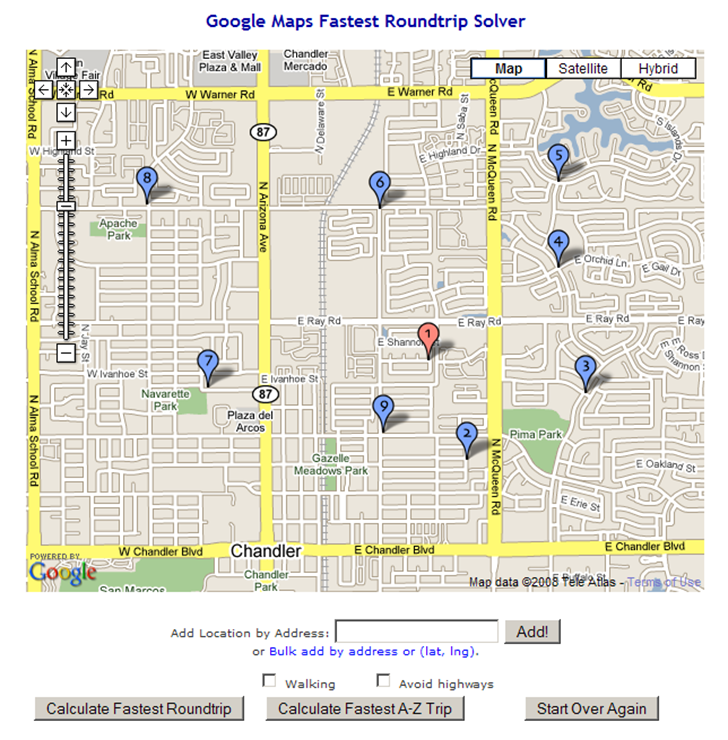
You can substitute “address” for “city”, making this an intra-urban travel problem. The OptiMap website solves this problem automatically for up to 24 locations (“nodes”). You can enter the nodes by clicking in a Google Maps interface:

12-1-2008-7.25.50 PM

You can also enter address nodes individually using the “Add Location By Address” box. Even better, you can add text lists of addresses or coordinates (latitude/longitude) by clicking on the “Bulk add by address or (lat, lng).” link, then copying and pasting the list into the text box that shows up. Latitude/longitude should be in decimal format, one set on each line, separated by commas and surrounded by parentheses, e.g. (35.333, –110.254). You can also specify only walking directions, and avoiding highways. The first node or address entered is always considered to be the starting point.

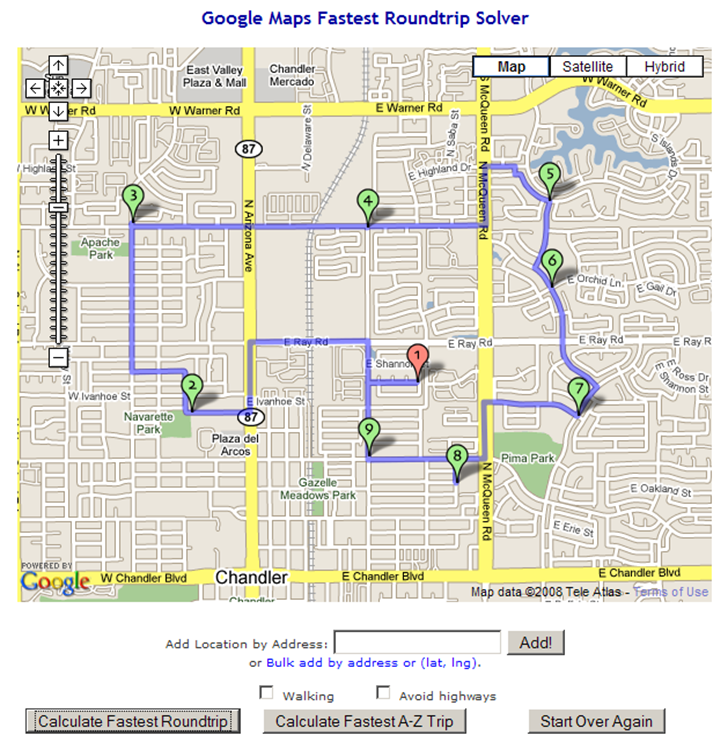
When you’re done entering nodes, click on “Calculate Fastest Roundtrip” to solve the problem for a round-trip that ends where you started:

12-1-2008-7.26.28 PM

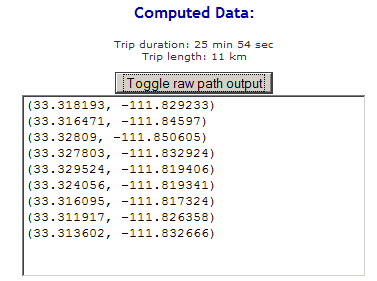
You’ll also get a set of Google Maps driving directions for the trip shown in the solution map. By clicking on the “Toggle raw path output” button, you’ll also get a text list of latitude/longitude coordinates in sequence for this route that you could convert into a GPS route:

12-1-2008-7.32.31 PM

The “Calculate Fastest A-Z Trip” works in a similar fashion, but for a one-way trip, where the first address/node you entered is taken as the start “A”, and the last address/node is the destination “Z”.

The technical background and source code are available on the OptiMap website, as are instructions on how to use this on your own website.