blankblank blank


Author Archive for Leszek Pawlowicz Page 19 of 79


Embed Voice Annotation In Google Earth Placemarks

Digital Geography suggests a neat way to quickly add voice annotation to Google Earth placemarks. Record your message at Vocaroo.com, and when you’re done, click on the “Post on the internet” link. You can then copy and paste the HTML code directly into the placemark Description section: right-click on the placemark, choose Properties, click on the Description if it isn’t showing, then directly paste the Vocaroo code there. When you click on the placemark, the pop-up balloon will display a Flash player for your audio message.

For more advanced annotation, it would probably be better to record and edit your message in MP3 format, upload it to a web location, then try one of the free embeddable Flash MP3 players described on this page. For example, for the Google Reader MP3 player, take the code:

<embed type=”application/x-shockwave-flash” src=”http://www.google.com/reader/ui/3247397568-audio-player.swf?audioUrl=MP3_FILE_URL” width=”400″ height=”27″ allowscriptaccess=”never” quality=”best” bgcolor=”#ffffff” wmode=”window” flashvars=”playerMode=embedded” />

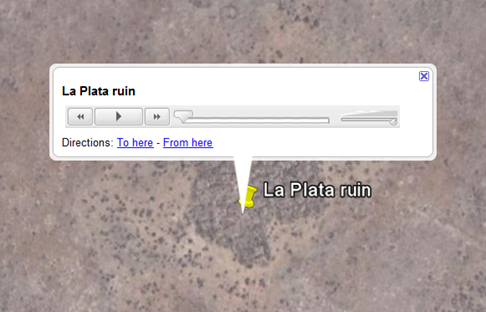
Note: Don’t copy and paste the above code, as that doesn’t work – copy and paste it from the code box on this website. Replace the “MP3_FILE_URL” section with the full link to your uploaded MP3 file, and then copy and paste the code into your placemark’s description section (same as above). Clicking on the placemark will bring up the balloon showing the MP3 player:
12-1-2008-9.50.34 AM

Just click on the play button to hear the message.


Two More Fire Mapping Websites

From comments on my previous post on the Web Fire Mapper come two more links to fire-related mapping sites:

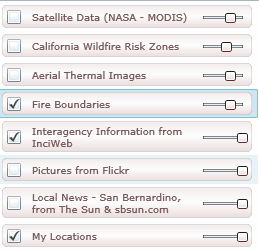
– The  Wildfire Information Portal (from Pitney-Bowes and the San Bernardino Sun) uses a Virtual Earth Interface to display wildfire-related layers with the transparency adjustable using sliders. Check a box to view a layer, click on the description to select it (Fire Boundaries in this case):

12-1-2008-8.38.12 AM

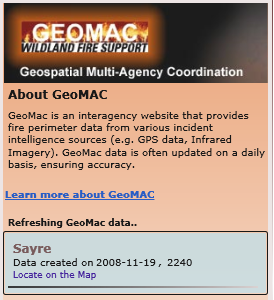
Below the layers panel, additional information and links to current data will appear:

12-1-2008-8.40.27 AM

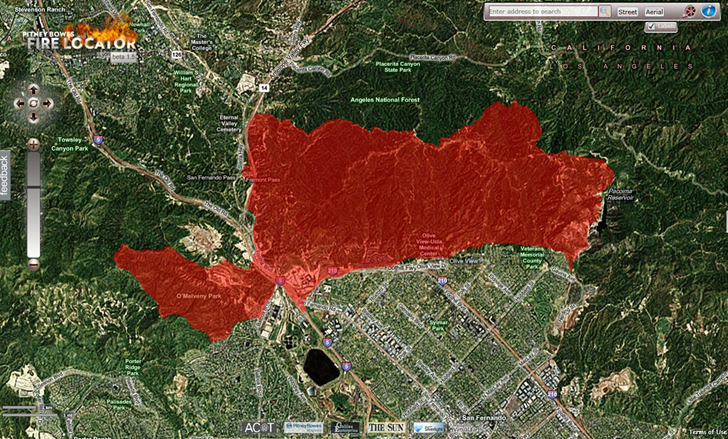
Click on “Locate on the Map” for a data entry, and the map display will zoom in to the selected area:

12-1-2008-8.42.16 AM

There’s a link to a video tutorial at upper right. It’s definitely California-oriented, and the only data currently visible is for that state, but the video indicates that the site displays data for the entire United States.

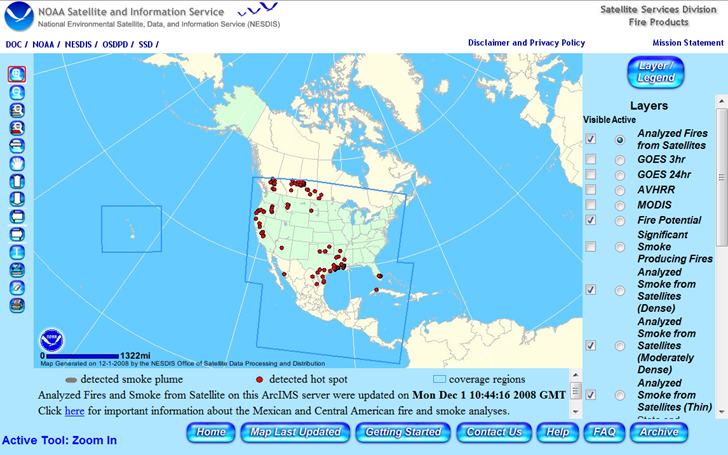
– From NOAA comes a viewer for their Satellite Services Division (SSD) Fire Detection Program, showing fire and smoke data for the US, Central America, and southern Canada:

12-1-2008-8.52.15 AM

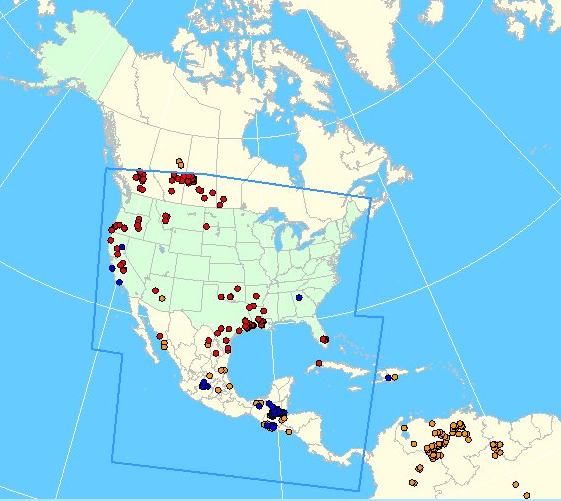
The default coverage (“Analyzed Fires from Satellites”) is shown above, but additional data for Central and South America can be seen by checking the AVHRR and MODIS boxes, then clicking “Refresh Map” at the bottom of the layers section:

12-1-2008-8.58.07 AM

HTs to joelarso and amlohdi.


Web Fire Mapper

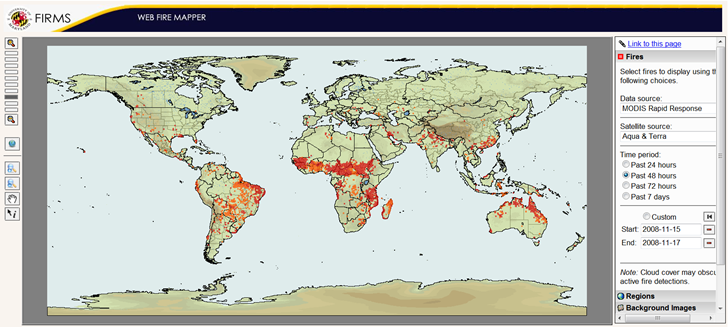
A timely data resource given the recent wildfires in California, the Web Fire Mapper plots the locations of fires across the globe as determined by measurements from the Aqua/Terra earth observation satellites:

11-16-2008-9.50.54 PM

  • Plot fires as seen by Aqua, Terra, or both, using MODIS (Moderate Resolution Imaging Spectroradiometer) observations
  • Choose a pre-selecting time period, or enter your own start/end times
  • Choose the background image: Blue Marble, Elevations and Rivers (as above), or None (just country outlines)
  • Enable additional layers: Administrative Boundaries (e.g. states), Cities and Protected Areas
  • The Download function isn’t working yet, but includes a link to a page where you can download GIS shapefile data for fires over the last 48 hours or last 7 days
  • If you create a view you like, click on “Link to this page” to create a bookmarkable link that saves those settings

Via La Cartoteca.


The US National Atlas Website

I’m never quite sure what to make of the US Government’s National Atlas website. Don’t get me wrong, I really like the site, but that’s as much a function of the serendipitous nature of the maps and data you can stumble across as it is its utility. I don’t know that I’d send someone there to look for a specific set of data, since the datasets and categorization are all over the place. But it’s a fun site to poke around in. Among the stuff you can find:

  • GIS-ready data in shapefile, DBF, SDTS-TVP and GeoTiff formats, covering a wide variety of topics both pedestrian (census demographic data, water bodies) and exotic (maps of butterfly distribution; magnetic field intensity)
  • An onsite MapMaker that lets you browse through information about different datasets, and then plot them interactively for export or printing

butterflymap

Distribution of Strecker’s Giant-Skipper butterfly in MapMaker

You may not find exactly what you’re looking for at this site, but it’s worth checking out just to see what they have.


Regional Statistics From The Organization For Economic Cooperation And Development (OECD)

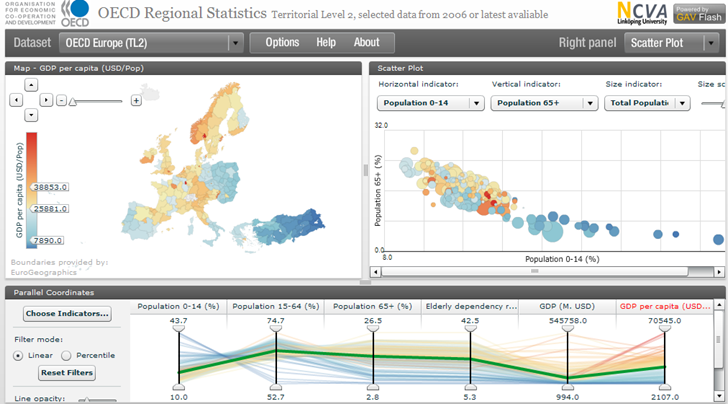
In the same vein as the StatPlanet app covered last week come another site for world demographic and economic data presented in a Flash map interface. The OECD Regional Statistics sites (Level 3 for small-scale data) :

11-10-2008-10.10.46 PM

There’s a limited number of plottable datasets (about 17), but the interface is terrific, perhaps the best I’ve seen for a site of this type. It was constructed using the Geovisual Analytics Visualization (GAV) Flash toolkit being developed at Linkoping University in Sweden. The data can be exported by selecting “Raw Text Data” from the dropdown menu at the upper right, and then copying/pasting the data into a text editor or spreadsheet; even more data is available from the OECD.Stat Extracts website.


KML Interactive Sampler

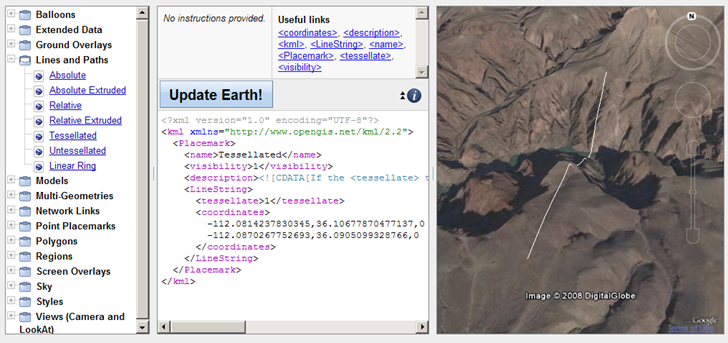
Want to learn KML by example, or see examples of the features you can display in Google Earth? The Google Geo APIs team has developed a KML Interactive Sampler page that uses the Google Earth Plugin to demonstrate various features, while simultaneously displaying the KML code used to create the feature:

KML interactive sampler

Always wondered what “tesselated”meant …

Modify the code in the text window and click on “Update Earth!”, and the displayed feature will be updated to reflect the new code. You can copy the text from the window, and then save it as a KML file locally on your computer.

Doesn’t support time yet, but neither does the Google Earth Plugin.


Breaking Up A Garmin gmapsupp.img Map File Into Separate Map Tiles

Yesterday’s post was about CloudMade, a website where you can download Garmin map files based on OpenStreetMap data for any country in the world that has OSM data. But all the map tiles for a country or state are combined into a single gmapsupp.img file, which means you can’t install the tiles into Garmin’s MapSource program. Because of this limitation, you can’t combine them with other mapsets and upload them to your Garmin GPS using MapSource. But there’s a simple way to break that gmapsupp.img file into the component subtiles, which can then be installed into MapSource, and uploaded with other mapsets.

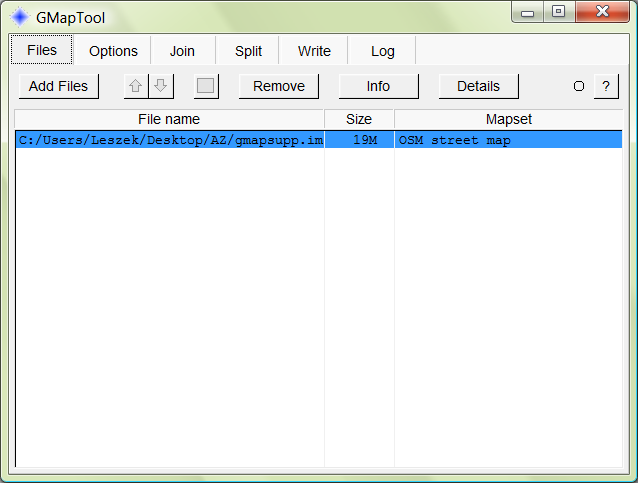
First, download the program gmaptool, and unzip it into the directory of your choice; this used to be a command-line utility, but now comes in a handy GUI format that drives the command line tool gmt.exe. Next, start up the program, navigate to the directory that contains the gmapsupp.img, and open the file:

gmaptool GUI

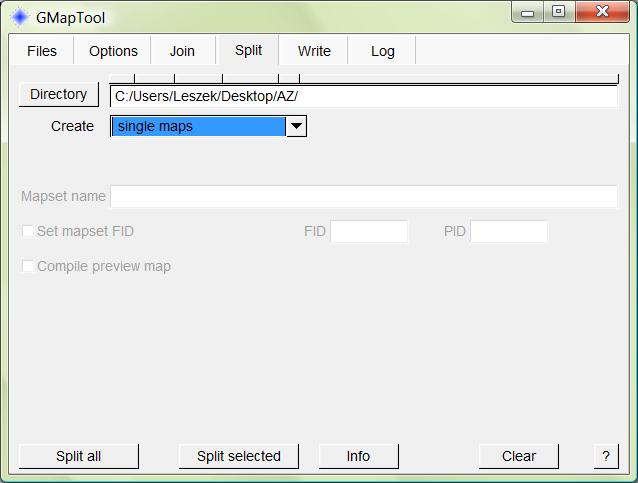
Click on the Split tab, select the directory you want to put the tiles in, and select “single maps” from the dropdown:

11-9-2008-9.11.34 PM

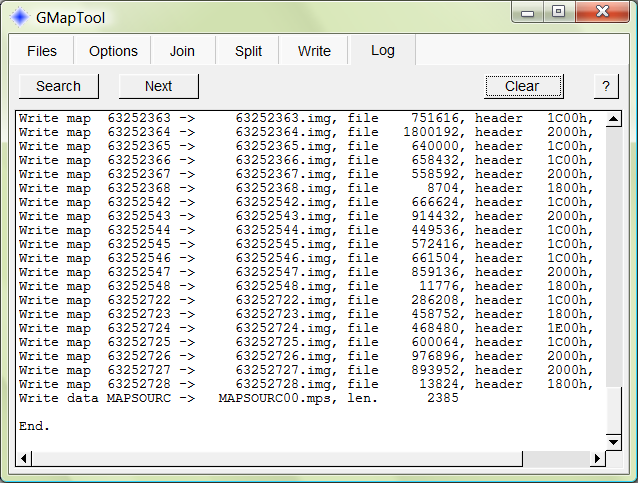
Click on the “Split all” button, and the subtiles contained with the gmapsupp.img file will be extracted, and listed in a status window:

11-9-2008-9.13.54 PM

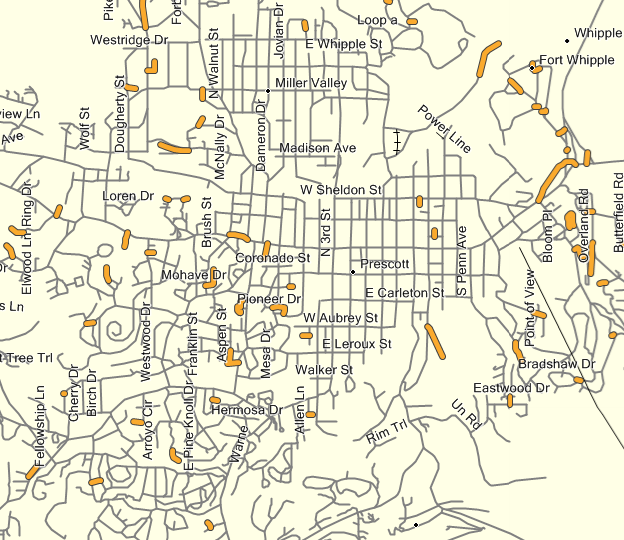
You can now use a program like MapSet Toolkit to install the tiles for viewing in MapSource, and uploading individually or combined with other mapsets into your Garmin GPS:

11-9-2008-9.15.17 PM

Note: The dropdown on the “Split” tab includes the option for creating files for installing the tiles directly into MapSource, but it doesn’t seem to be working right now. Running the install.bat file gives an error message saying that the needed program cgpsmapper can’t be found, and specifying the path for this file under the Options tab doesn’t solve the problem. I suspect this will work at some point in the future.

The command line program gmt.exe driven by the GMapTool GUI contains many additional advanced functions for handling Garmin map files, not all of which are currently accessible using the GUI, including removing/changing unlock codes (no, this won’t let you pirate Garmin mapsets), making maps transparent, and more. Check the readme.txt file that comes with the program for more info; there’s also a “gmaptool_en.html” help file with more info on the GMapTool GUI.


More Garmin Maps From Open Street Map Data

Apropos of the previous post on Garmin maps from Open Street Map (OSM) data, there’s a listing of Garmin mapsets for a limited number of countries at the OSM wiki site. Some come with installers, others are .img files that you will need to install into MapSource using MapSet Toolkit. Included are a set of Garmin map tiles for the entire world from computer:teddy, which you could use to create a Garmin mapset for any country. But the process is a bit time-consuming, and the instructions on the web page are in German; if you don’t read German, you may be better off with the CloudMade maps.

HT to Rich Owings of GPS Tracklog.