A while back, I posted on GeoFabrik’s repository of Open Street Map (OSM) data in shapefile format, covering mainly Europe and parts of Asia. CloudMade now has this data freely available for download as well, but not just in shapefile format, and not just Europe, but every continent (including Antarctica). Broken down by country/state, you can download:
- OSM XML extracts
- Garmin Map Files (OSM.err edition)
- Osmosis country bounding polygon
- Shapefile extracts
- Navit maps
- GPX POI
- TomTom POI
The latter two are a bit lacking in data now, to put it mildly, but presumably will grow in size with time. CloudMade is developing APIs to deliver the OSM map data in web and mobile format, but these are currently in alpha and limited to developers.
The Garmin data comes as a gmapsupp.img file, which you can copy directly to the SD/microSD card of a compatible Garmin unit; see this post for more info. The problem with Garmin map data in this format is that you are limited to having only the data embedded within that single file loaded into your GPS; you can’t combine it directly with other Garmin mapsets. And because the gmapsupp.img file can contain multiple sub-tiles, you can’t add it to the MapSource program using MapSet Toolkit; trying to do so will only make a single sub-tile visible. But there’s a way to split that gmapsupp.img file into its constituent sub-tiles, making it installable into MapSource, and I’ll cover that in tomorrow’s post.
Just found out about this feature recently: if you enter a location into the search box in Google Maps, you can download the result as a waypoint directly to some GPS systems, including Garmin and TomTom. After you get a search result in Google Maps, click on the “Send” link in the upper left:
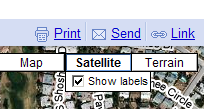
You’ll get a box that comes up with the default to email the map link, but there are additional links for Car and GPS:
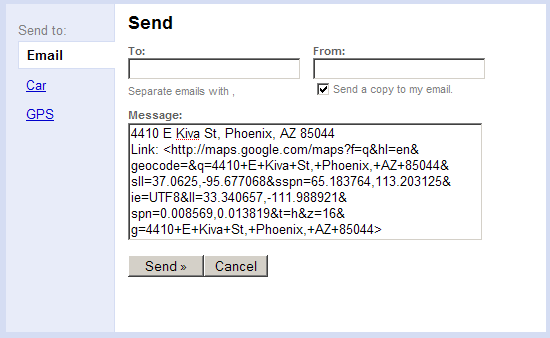
Click on GPS, and choose your brand: Garmin, Pioneer or TomTom:
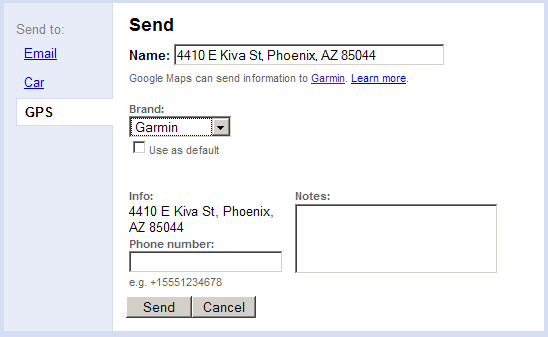
Click on Send, and you’ll be directed to a page that lets you download it to your GPS:
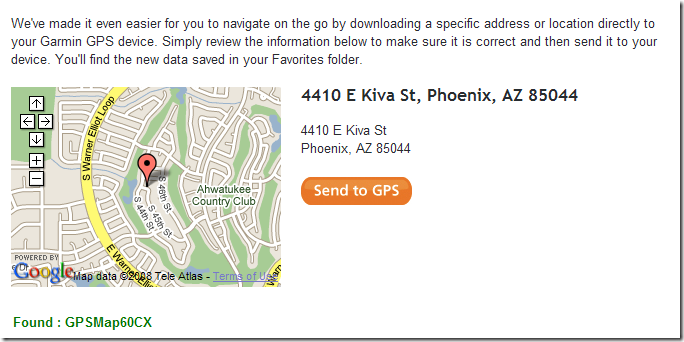
To use this feature, you’ll need to have the right software installed on your computer to use it with your GPS:
Clicking on the Car option brings up the option to send the waypoint to a BMW or Mercedes-Benz built-in GPS if you have a BMW Assist or Mercedes Tele-Aid account.
Just released by Frank van Cappelle of SACMEQ (Southern and Eastern Africa Consortium for Monitoring Educational Quality) is StatPlanet, an interactive application for exploring worldwide demographic, educational, health and socio-economic indicators. Plot choropleth and proportional maps, bar and scatter plots:
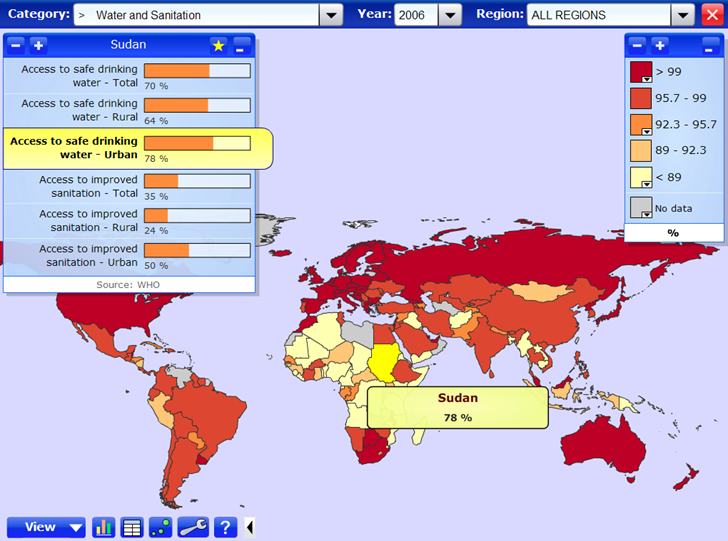
The application is highly interactive – pass your cursor over the map, or a plot, and get additional data breakdowns. There’s both an online version and a downloadable stand-alone Flash version for Windows systems, and an excellent one-page Features/How-To section on the main download page.
Don’t have access to Access (ha ha), but stumbled across this and thought some might find it useful: a VBA macro for Microsoft Access that exports a table/query with latitude and longitude to Google Earth’s KML format. The original code has disappeared, but a page that offers explanations and augmentations to the original code can be found here.
Also tucked away in my bookmarks was this link to a Google Earth community post offering an XSL-based tool for exporting from Access to KML. The link to the downloadable file seems to be missing, but I snagged it at the time, and you can download it from this link.
As I said, haven’t tried any of these – use at your own risk/discretion.
This is one of the neater online mapping applications I’ve seen in a while. Create a list of addresses and related information in a Google Docs spreadsheet, and map a list will geocode the addresses (convert the address to latitude/longitude), and plot the location and data in a Google Maps interface:
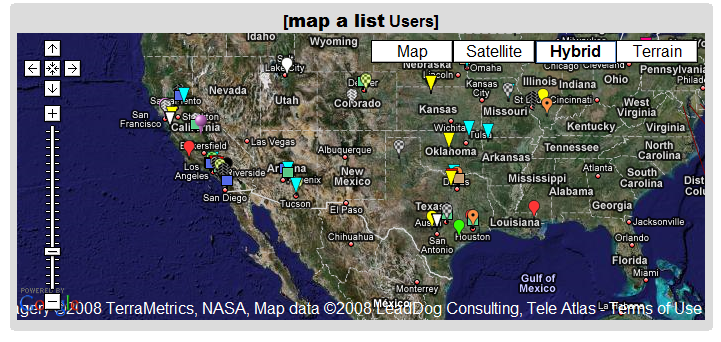
You can also export the data as a KML file for use in Google Earth.
- User-selectable icons
- Also plots latitude/longitude locations
- Includes data in other spreadsheet columns in the data bubble
- Lets you embed images and hyperlinks as well
- Data can be public or private
- As you update the spreadsheet, the map data is updated as well (daily, or on demand)
- Not a lot of documentation, but it’s fairly easy to use, and a healthy number of example spreadsheets will show you how it’s done (scroll through the list at the bottom, and click on the link to see the sample spreadsheet for each list item)
- Completely free (though they’ll take donations, and offer premium consulting services for a fee)
Definitely worth bookmarking.
ogr2ogr is a simple command line utility that converts between supported vector file formats. For those who don’t like dealing with command line programs, and need only limited conversion capability, Inventis has written a simple Windows front-end for ogr2ogr called ogr2gui:
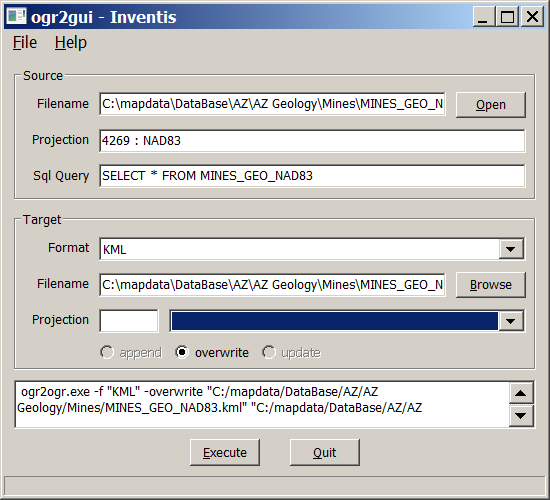
Documentation is limited, so it’s not clear which input formats are fully supported. For example, input shapefiles work, but I had problems getting E00 files to convert (see this post for an E00 to shapefile conversion process that does work). Hopefully documentation will improve with time along with functionality (this is already the fourth release).
Output formats are limited to:
- Shapefile
- MapInfo
- KML
- GML
- CSV
Converting shapefiles to Google Earth’s KML format works as long as the shapefile is in latitude/longitude format, WGS84; attribute table data added to the placemark pop-up for point shapefiles, but not lines or areas. There are better converters for shapefiles to KML conversion like shp2kml, but this is a good choice for converting other less-well-supported vector formats into the supported output formats..
Got coordinates in degree-minute-second degrees, and need them in decimal format fast? Or the reverse? Go to Google Maps, enter the coordinates into the search box. e.g. +34 59′ 59.00″, -109 59′ 59.00″, and get a map with a pop-up containing the converted coordinates:
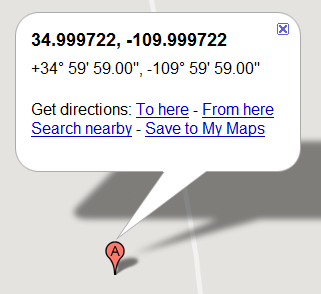
You can then copy and paste the pop-up text into another application. It does have one minor bug – type in an even latitude/longitude, like 3,-110, and you’ll get this:
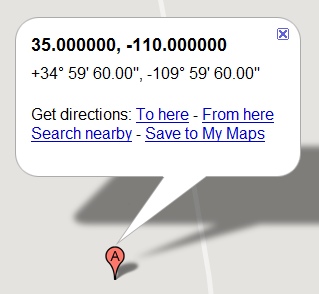
Obviously, instead of 59 minutes and 60 seconds, the degree numbers should be one higher. Not a situation you’ll see often, though …
If you do this on a regular basis, you might take a look at some earlier posts on this blog that talk about stand-alone options:
Via Mapping Hacks.
I’ve covered ColorBrewer, an application for assessing color schemes for maps, in a previous post. In the same spirit comes TypeBrewer, an online application that “offers a quick and easy way to explore typographic alternatives and see the impact that various elements of type have on the overall look and feel of a map”. It doesn’t actually design a map, but rather shows you how different fonts and styles appear on a sample map. Select a set of sample font types from the initial choices:
Continue reading ‘Assessing Map Font Styles With TypeBrewer’

