blankblank blank


Author Archive for Leszek Pawlowicz Page 15 of 79


Create A Random Point Or Evenly-Spaced Point Grid Shapefile Within A Defined Area

Got an email question about how to create point grids in GIS format with free software, and the off-the-top-of-my-head solution was fGIS. fGIS (Forestry GIS) is a decent freeware GIS developed by the Wisconsin Department of Natural Resources using the TatukGIS Developer Kernel. Up until late 2005, updated versions were being released regularly as freeware, but a change in the Kernel licensing conditions made that impossible for future versions. The last free version is still available, but is not guaranteed to be bug-free and will never be fixed or updated. Still, it has some useful utilities, including the “Generate Cruise Points” tool, available from the Utilities menu; this tool lets you create random and regularly-spaced point shapefiles for a defined area.

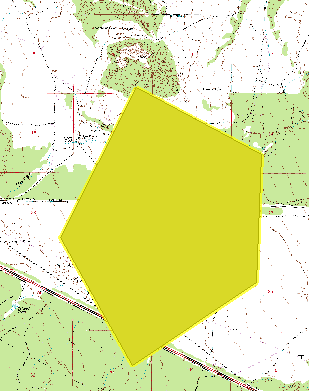
Start up fGIS,  and you’ll be asked to define a project name right away. The coordinate system will be defined by the first layer you add, either raster or vector, and whatever data layers you add to the program must be in the same coordinate system. The program supports many different formats, vector and raster, including shapefile and GeoTiff. You’ll need to have the area you want gridded defined by a vector layer, either one you open or one you create using the program’s vector editing functions; e.g. you could open a raster GeoTiff, then draw a polygon defining the area you want gridded on top of the raster image. You also need to highlight the polygon area you want to have gridded using the “Pick” tool (the red arrow icon at the top):
2-4-2009-2.54.08 PM

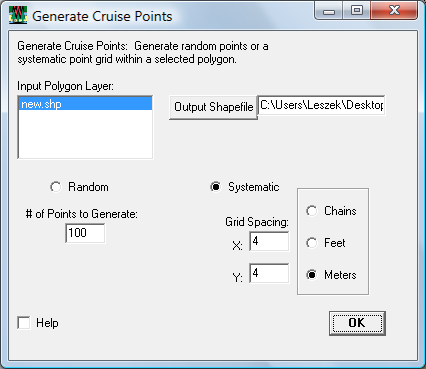
Then select Utilities => Generate Cruise Points:
2-4-2009-2.54.49 PM

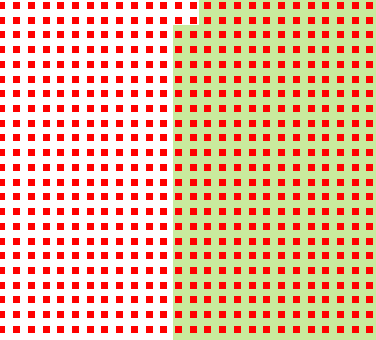
Here, new.shp is the polygon shapefile with the highlighted area to be gridded; specify the output grid point shapefile by clicking on the “Output Shapefile” button (entering the directory in the box at right has no effect). Then choose either a random grid and the number of random points, or a systematic grid with the desired spacing and units. Click OK, and the grid shapefile will be created and added to the map view; if the area is large, and the spacing is small, this may take a while. Here’s that grid shapefile plotted on top of the original raster (zoomed in very close):
2-4-2009-2.53.21 PM

With software like DNRGarmin, you could upload such a grid to your GPS as a set of sampling points.
Historic French Maps (17th-19th Century)

Making Maps posts about HistCarto, a site with 4000 searchable and viewable historic maps of France, dating from the 17th to 19th centuries. The site is in French, so you may want to have Google Translator handy if you don’t speak the language. But for a quick view of some of the maps:

  • Click on the “Acces a la base” link at the right to go to the database page
  • Click on “Recherche” (Search) at left, then “Simple”
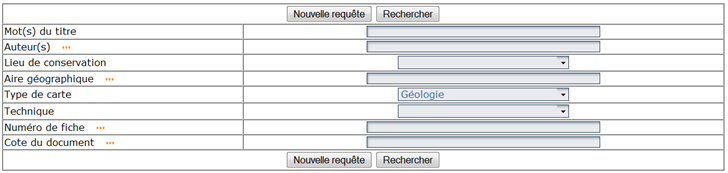
  • Click on the “Type de carte” (type of map) dropdown, then choose a type of map you’d like to see; many types will be obvious to many non-French speakers. In the example below, I’ve select “Geologie”, which oddly enough is geology:

2-3-2009-10.39.16 AM

  • Other search options are “Mot(s) du titre” – words in the title; “Auteur” – author; “Lieu de conservation” – source of the map; “Aire geographique” – geographic area; “Technique” – whether the map is a printed map (“Carte imprimee annotee” or hand-drawn (“Carte manuscrite”). Caveat: my high school French is a bit rusty :).
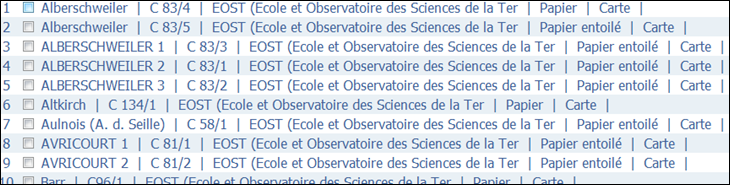
  • Click on “Rechercher” to retrieve a list of maps of that type:

2-3-2009-10.41.35 AM

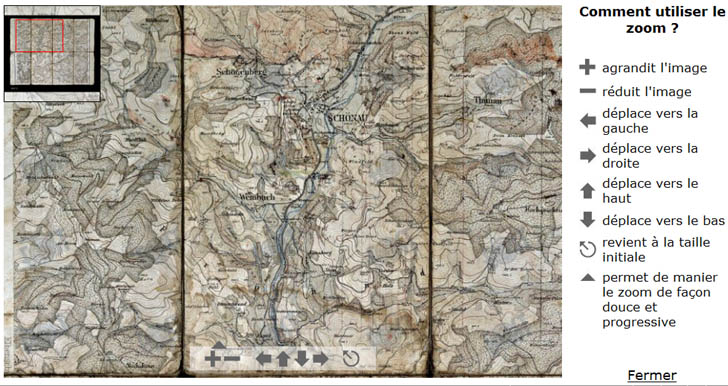
  • Click on a listing to retrieve the info page for that map; click on the map image at the bottom of the info page to bring up a pop-up Flash Zoomify viewer with the map loaded:

france_geology1

Note: The map is of a region in France, but was created in Germany, hence some of the German names.

No downloadable versions of the maps, unfortunately.


Splitting A GPX Track Into Smaller Files

Some GPS models, such as most Garmin handheld units, allow you to record up to 10,000 points as the active track. But if you save an active track with more than 500 points, the unit will automatically simplify the track to a maximum of 500 points, dropping what it considers to be redundant or unnecessary points; you have no control over which points get dropped by the unit. One option is to simplify the track yourself with GPS Trackmaker’s Tracklog Reducer, which also drops points but gives you some control over the degree of simplification. But if you absolutely have to preserve all the points, there’s another option; GPX Track Splitter lets you chop a track with more than 500 points into a set of smaller tracks that come in under this limit, but which preserve all the points.

Continue reading ‘Splitting A GPX Track Into Smaller Files’


Online Geocoding, Address Verification And Shortest Path Utilities From the USC GIS Research Laboratory

The USC GIS Research Laboratory offers a number of online geographic applications and Web APIs. You have to register for the services, and you’ll get 5000 use credits. After those are used up, the services are free for non-profit and non-commercial enterprises, as long as you cite/reference their use somewhere. For commercial use, if you post an attribution to the service on your website, and also allow them to use your name/logo on their website, you can also use it for free; if not, you can also buy processing credits from them. See this page on usage costs for more info.

Continue reading ‘Online Geocoding, Address Verification And Shortest Path Utilities From the USC GIS Research Laboratory’


The Big List Of Satellite/Aerial Imagery Analysis Programs V – GIS

The last in this series (parts one, two, three, and four). The previous applications have been primarily focused on remote sensing applications, but there are also a number of general purpose freeware GIS programs that include significant remote sensing analysis capabilities.

GRASS

A powerful but often difficult to use GIS program. Quantum GIS is implementing an easier interface for GRASS’s capabilities. A Java version of GRASS (JGRASS) is being built on top of uDIG, but is concentrating on hydrogeological and geomorphological capabilities for now.

  • Canonical component analysis (CCA)
  • Color composite generation
  • Edge detection
  • Frequency filtering (Fourier, convolution matrices)
  • Fourier and inverse fourier transformation
  • Histogram stretching
  • IHS transformation to RGB
  • Image rectification (affine and polynomial transformations on raster and vector targets)
  • Ortho photo rectification
  • Principal component analysis (PCA)
  • Radiometric corrections (Fourier)
  • Resampling
  • Resolution enhancement (with RGB/IHS)
  • RGB to IHS transformation
  • Texture oriented classification (sequential maximum a posteriori classification)
  • Shape detection
  • Supervised classification (training areas, maximum likelihood classification)
  • Unsupervised classification (minimum distance clustering, maximum likelihood classification)

gvSIG

gvSIG is moving towards release of version 2.0, which will add a substantial number of remote sensing analysis functions. If you want to look at an early version, there’s a 1.9 alpha release available.

– Clipping of bands and data
– Export layers
– Save from view to raster file
– Color table and gradient edition
– No data values management
– Pixel process (filters)
– Color interpretation management
– Overview creation
– Enhanced radiometric
– Histogram
– Geolocation
– Raster reprojection
– Georeferencing
– Automatic vectorization
– Band algebra
– Region of Interest (ROI) definition
– Supervised classification
– Semi-supervised classification
– Decision tree
– Transformations
– Image fusion
– Mosaic
– Scatter diagram
– Image profiles

ILWIS

Integrated Land and Water Information System, formerly commercial software, now open source.

  • Image enhancement (contrast, linear stretching)
  • Filtering
  • Band combination and compositing
  • Band ratios and indices
  • Georeferencing
  • Multi-band statistics
  • Principal component analysis
  • Image arithmetic
  • Image fusion (e.g. pan-sharpening)
  • Image classification

MicroDEM

A very strong terrain/DEM analysis program, but has other applications as well, including remote sensing.

  • Contrast enhancement
  • Filters
  • Band histograms
  • Correlation (covariance) matrix
  • Scattergrams
  • Band ratios and normalized indices (e.g. NDVI)
  • Principal components analysis
  • Multi-band merges
  • Image training and classification
  • Hyperspectral image analysis (AVIRIS)
  • Image averaging
  • Pan-sharpening

SAGA

Not primarily a remote sensing application, but has some modules for grid manipulation, statistics and analysis that could be useful.

Spring

  • LANDSAT, SPOT, ERS-1 and NOAA/AVHRR Data input;
  • Registration and Geometric Correction;
  • Image Mosaic with gray level equalization;
  • Image Enhancement by Histogram Manipulation;
  • Spatial Filtering;
  • IHS and Principal Components Transformations;
  • Arithmetical Operations;
  • Pixel Values Reading;
  • Maximum-likelihood pixel-based classifier;
  • Image Segmentation and Region Classifiers (Supervised and Unsupervised);
  • LANDSAT and SPOT Images Restoration;
  • Morphological Filters for Images;
  • Mixture Models;
  • Markov-based Techniques for Image Post-Classification;
  • Radar Image Processing.
  • And if you want to create your own remote sensing analysis program, or add capabilities to a GIS, there’s the Orfeo Toolbox (OTB), an open-source library/API for image processing:

    • image access: optimized read/write access for most of remote sensing image formats, meta-data access, simple visualization;
    • sensor geometry: sensor models, cartographic projections;
    • radiometry: atmospheric corrections, vegetation indices;
    • filtering: blurring, denoising, enhancement;
    • fusion: image pansharpening;
    • feature extraction: interest points, alignments, lines;
    • image segmentation: region growing, watershed, level sets;
    • classification: K-means, SVM, Markov random fields;
    • change detection.

    HT to Melaneum in comments.


    Self-Colored Map Graphics

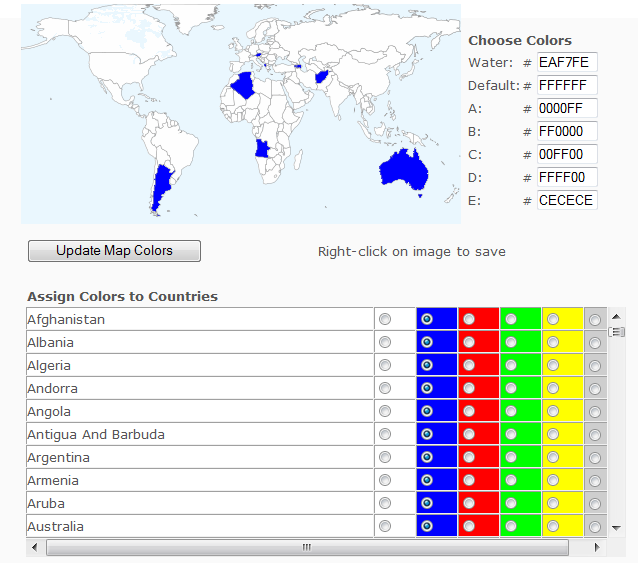
    A while back, I covered a web app that lets you color in countries on a world map, then download the resulting graphic. Since then, it’s added more features, including the ability to add text, lines and labels. Mike Piaget writes to tell me of a similar app he’s created, the Customizable Map Of The World. Not as many options as the other app, but easier to use:

    2-4-2009-1.48.12 PM

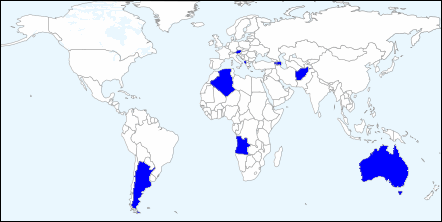
    Click on a color next to the country name, then click “Update Map Colors” to color the country on the map; here, I’ve colored all world countries that start with the letter “A”. There’s only six colors available for country colors (including the default), plus one for water, but you can modify those colors with the appropriate hex code at upper right. To save a copy of the map to your computer, right-click on the image and choose the “Save Picture As ..” option (or the equivalent in your browser):

    chart

    Unfortunately, you’re limited to the single on-screen size; however, there are closeup maps available for the subregions Africa, Europe, Asia, the Middle East and South America (links at the bottom of the web app page).


    GPS Support Added To Free Version Of Google Earth

    A few months ago, Google discontinued Google Earth Plus, their $20/year augmented version of Google Earth. At the time, they said they would add one of Plus’s key features, support for direct connection of a GPS receiver, to the free version in the near future. With this week’s release of Google Earth 5.0, lots of attention has been paid to its big new features (ocean coverage, historic imagery, tour recording); see Ogle Earth and the Google Earth blog for more info on those. But I’ve only seen one or two mentions that this latest version adds GPS support.

    Access the GPS control with Tools => GPS:

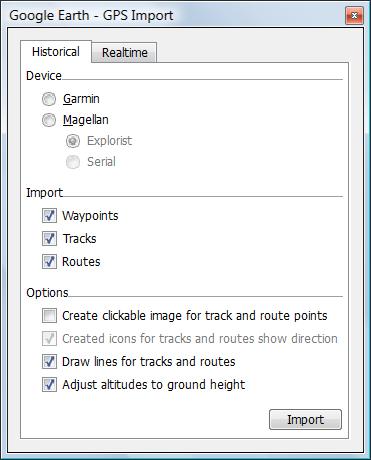
    Google Earth GPS import

    The Historical tab lets you import waypoints, tracks and routes from either a Garmin or Magellan GPS (the only brands currently supported). Garmin support should include the serial as well as USB interfaces, but I don’t have a serial connection to test that. Checking the “Create clickable image …” link assigns icons to the track/route points with pop-up data for them; checking the box below that creates icons to show the direction of movement.

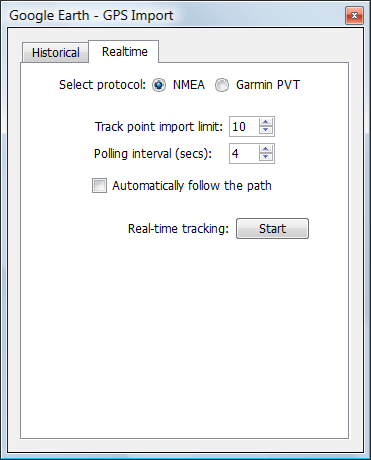
    The Realtime tab shows the options for live tracking of your position in Google Earth:

    Google Earth GPS tracking

    Currently, it supports only the Garmin protocol and NMEA (serial connection, either through a serial port or Bluetooth); I’ve tried both, and it does a good job of finding the correct port. Polling interval determines how often GE gets position data from your GPS, while “Track point import limit” determines how many position points are imported and averaged for every polling. More points means a slower position update, but a more accurate one; less points updates your position more quickly, but potentially at the cost of accuracy. If you have a high-quality GPS receiver, with strong satellite reception, accuracy is unlikely to be a serious issue, and you can probably set the track point import limit to a low number.

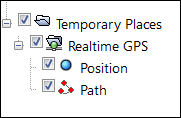
    Checking the “Automatically follow the path” box will make Google Earth automatically zoom to the current GPS location, and follow it as it changes. The only view you have with this option is from overhead; if you change to an oblique view, it will automatically move the view back to overhead. The option is ghosted out as soon as you start tracking, so if you don’t check the box, the only way to immediately zoom to the current GPS position is to go into “Temporary Places”, find the Position marker in the RealTime GPS folder, and double-click on it:

    2-3-2009-10.45.14 AM2-3-2009-9.49.06 PM

    If you move, it also saves your path and displays it onscreen; to save it permanently when you’re done, you’ll have to right-click on the “Path” listing and save it as a KML file. I believe the Position icon is supposed to show up in the Google Earth display to show your current position, but for static positions it disappears almost immediately.

    For simplicity and convenience, Google Earth’s built-in GPS interface is hard to beat. But for real-time tracking, the feature set is pretty weak; the limited GPS receiver support, the inability to view from an oblique angle with live tracking, and problems with icon display (and lack of choice for the icon) are serious drawbacks. The data import feature also isn’t that great; you’d be better off using a program like EasyGPS or GPSTrackmaker to import data from your GPS, and then save it either in GPX format (which Google Earth can open), or directly in KML format. The free version of GPS Trackmaker comes with a real-time GPS position interface which supports more units than Google Earth, and which can plot your rea-time position in Google Earth. There are other options for GPS real-time tracking and data import into Google Earth as well; do a search on this blog for “Google Earth” and “GPS”.


    US Surname Maps

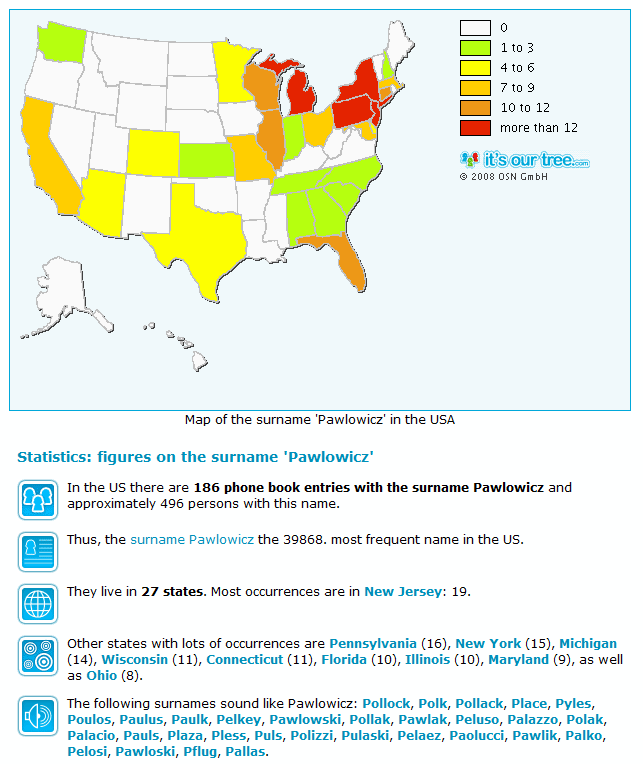
    A while back, I covered the World Names Profiler, a program for plotting the population density for surnames for countries around the world. Dynastree Maps is a similar application for the US, Canada, and Germany, and includes additional information:

    2-2-2009-12.11.20 PM

    Note: Currently only works in Internet Explorer and Safari. I also get a Javascript error message, but it doesn’t seem to affect functionality.

    Via Webware.