The Australian government’s GeoScience Australia website offers downloads of a wide variety of map and GIS data. There’s a web interface called MapConnect that you can try for selecting topographic and geology data for download and creating custom PDF maps:
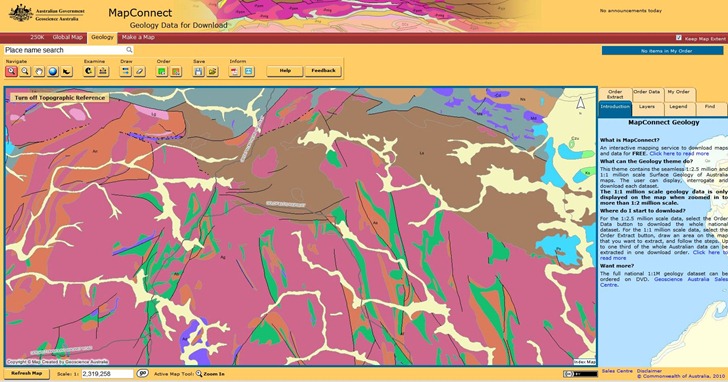
But I found it a bit confusing to navigate and use. You might do better to go to some of the other pages that let you browse and/or search for data, even though finding data this way may take a while.
Lots more to find, if you poke around the site for a while.
HT to m. bouchon.
Must be Latin week on this site; following yesterday’s post on the latest release of the Spanish GIS gvSIG, the Brazilian geospatial modeling program Dinamica EGO (Environment for Geoprocessing Objects) sent me an email announcing release of version 1.6. Wasn’t previously aware of the program; from the website:
Dinamica EGO consists of a sophisticated platform for environmental modeling with outstanding possibilities for the design from the very simple static spatial model to very complex dynamic ones, which can ultimately involve nested iterations, multi-transitions, dynamic feedbacks, multi-region and multi-scale approach, decision processes for bifurcating and joining execution pipelines, and a series of complex spatial algorithms for the analysis and simulation of space-time phenomena.
The software environment, written in C++ and Java, holds a series of algorithms called functors. Each functor performs an operation. We have implemented the most common spatial analysis algorithms available in commercial GIS (Geographic Information System), plus a series of algorithms especially designed for spatial simulations, including transition functions and calibration and validation methods. Dinamica EGO functors are sequenced in a graph form to establish a visual data flow. With the help of its graphical interface, one can create models by simply dragging and connecting functors via their ports, each of which represents a connector to a data element, such as a map, a table, a matrix, a mathematical expression, or a constant. Thus, models can be designed as a diagram, whose execution follows a data flow chain. This friendly interface allows for creative design of spatial models that are saved in XML format or EGO programming script language. In sum, Dinamica-EGO favors simplicity, flexibility, and performance, optimizing speed and computer resources, such as memory and parallel processing.
I’m not even going to pretend that I understand its full utility, but hopefully some of you do and might find this useful. List of new features (and those added in earlier version releases) available here. Free download for educational and scientific purposes only; registration required
This news is a bit late, but the free multi-platform GIS gvSIG has just officially released version 1.10. Listed changes:
- gvSIG 1.9 bug fixes
- Windows Vista and Windows 7 compatibility
- Binaries compilation for JVM 1.6 (with JVM 1.5 compatibility)
- Sextante 0.6 extension integration (GRASS 6.4 interface included)
- NavTable extension integration (latest version)
- Pie and bar chart legend
- Relative path support
Probably the biggest change is the integration of the Sextante plug-in, previously available separately as an extension. This integrates not just a GRASS 6.4 interface, but also many of the spatial analysis / conversion / utility modules previously available in the SAGA GIS program. I was never a big fan of SAGA’s data viewing capabilities, but if the need ever arose for an unusual GIS processing capability, there was a good chance I’d find it in SAGA’s modules; having them now available from gvSIG with Sextant is a big plus. Documentation for Sextante is available here, though annoyingly you’ll have to register to be allowed access to the PDF files. A free, multi-platform GIS, gvSIG has an excellent mix of ease of use and capabilities; highly recommended, even if only for a test drive or occasional use of some its more advanced capabilities.
Oxford Archaeology Digital has a version of gvSIG based on 1.10 that cleans up the installation process a bit, and smooths out some of the rough edges in the translation from gvSIG’s native Spanish to English; find it here.
Cartographer: Free Javascript libraries (MIT License) for generating basic thematic maps.
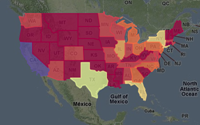
Choropleth |
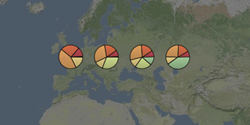 Pie charts Pie charts |
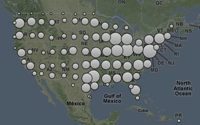
Cluster |
Links to additional live examples at the website. You can hard-code data values, or retrieve them from an online source like a Google Spreadsheet.
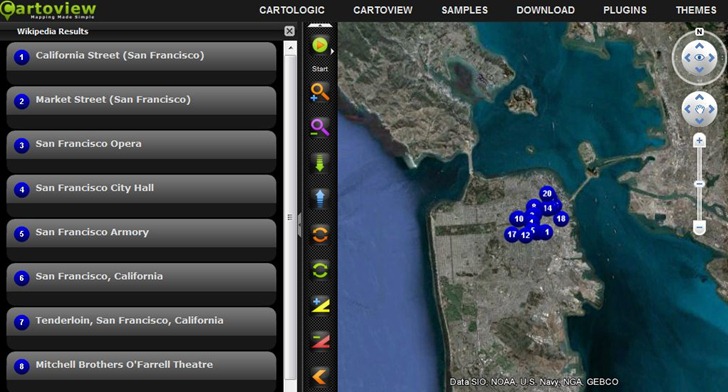
Cartoview: Open source software that “makes building and editing maps a breeze…”. I wouldn’t go quite that far – I think you’ll need quite a bit of experience with Javascript, Google Maps and webservers to get this up and running. But there’s a substantial amount of help available, including tutorials, online help files, and a user forum. There are also a number of online demos, with links to downloadable source code for the demos to help you figure out how to do stuff. I gotta say, some of the demos look very impressive, like this Google Earth plugin view that lets you plot points/data from online resources (Wikipedia, Yelp, Foursquare, Twitter, etc.), with user-definable interface styles:
The OpenTopography Portal is a GEON Project initiative to build an online system that provides integrated access to high-resolution topographic data, web-based processing tools, and enables the user community to share knowledge, experiences and resources
The OpenTopography Portal offers free downloads of LIDAR data in raw point cloud formats, processed DEMs, and Google Earth image overlays (reflectance):
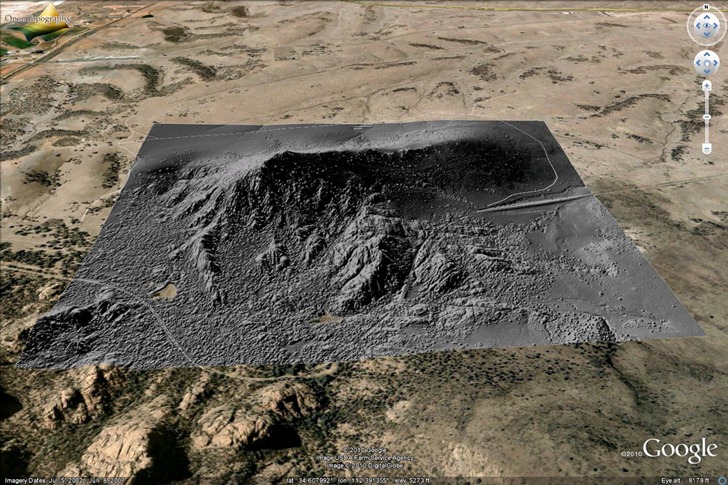
Data resolution is typically at least one meter, and sometimes better than that. Biggest problem with the site now is sparse area coverage; they’re relying on voluntary donations of data, and so far, the overwhelming majority of data is earthquake fault zones in California:
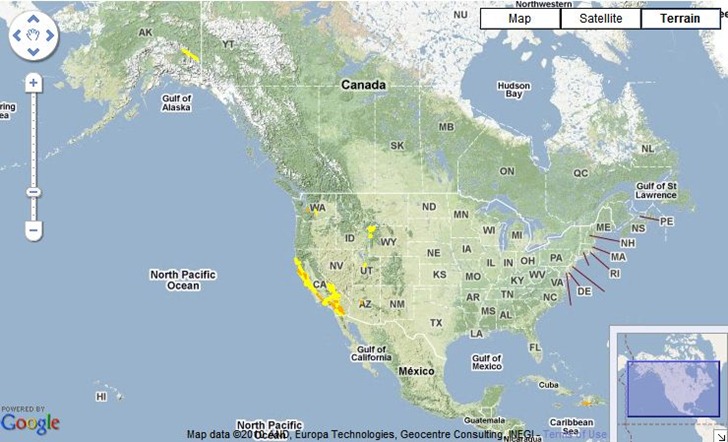
There’s a smattering of additional data for Alaska, Washington, Wyoming, Utah, Arizona and Haiti, but only a small fraction of the US is currently covered. The site/project is still active, so hopefully additional areas will be added in the near future. At the very least, it’s a useful site for getting sample LIDAR data to play around with.
Cartography 2.0 is (was?) an attempt by geographers at Penn State, University of Wisconsin – Madison, and Axis Maps to create an online up-to-date textbook (Creative Commons license) on making modern digital interactive maps. Current chapters online:
- Overview of Animated Maps: Learning from others
- History Of Animated Maps
- Conceptualizing Time, Change and Geographic Process
- Representing Time on Animated Maps
- Representing Time on Static Maps
- Cartographic Text
- Cartographic Interaction: Introduction and Overview
- Multiple, Coordinated Views, Brushing, & Highlighting
- Data Probing and Info Window Design
- Overview: The User Interface
- Interface Evaluation 1: Philosophy
- The Nature of Geospatial Information Uncertainty
Not a how-to guide, more a discussion of history and basic principles, but worth reading just for that. Status is unclear: all of the above chapters are dated September 2009, and while the site states it’s active, there don’t appear to have been any recent additions. I hope it is still active – lots of good stuff just in what’s been posted already.
APSalin, a company specializing in “Software development and data management for radio and television broadcast engineering”, offers a free set of handy online calculators and reference materials:
- Converters to/from geographic/geodetic – Mercator – UTM – Cartesian coordinates
- NAD27 to NAD 83 converter (latitude/longitude only)
- Latitude/longitude DMS to decimal & vice versa
- Great circle distance/bearing between two points
- Destination (enter position-bearing-distance, get coordinates of destination)
- Reference tables showing what distances on map represent for various map scales, and what various distances in real life correspond to on a map at a specific scale. Tables are given for both metric and imperial units; if you ever need an argument for doing everything in metric, this is a good place to start.
- Reference tables for DEM resolutions in arc-seconds converted to meters and feet
- Ellipsoid parameters for various datums
The Map Envelope site lets you select a location, then generates a printable envelope with a Google Maps image of the map location printed inside. Select a location and message in the main interface:
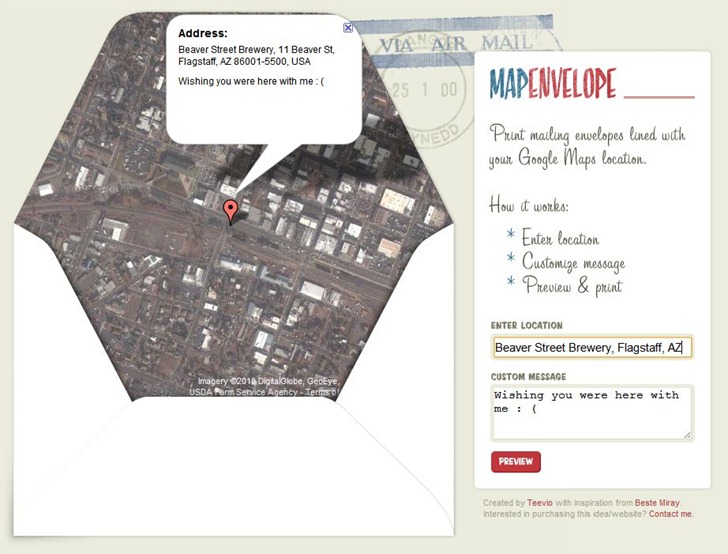
When you’re happy with the view, hit the Preview button to see how the template will look like before you print it:
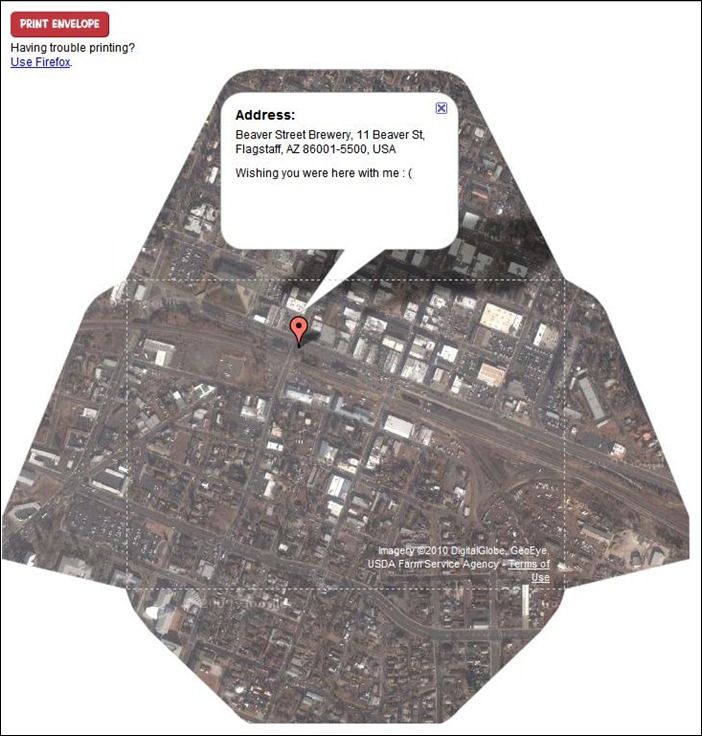
Then hit “Print Envelope”, cut out the map, fold along the dotted lines, and tape/glue it together to finish the envelope.
Tips:
- Print Envelope button may not always be responsive – may take several pushes for it to register.
- Printing worked fine in both Chrome and Internet Explorer, so you can probably ignore the “Get Firefox” message.
- You can’t scroll the map image around to position it exactly, so you’ll need to be as specific as possible for the location. Addresses work well, as do latitude/longitude coordinates (get these from Google Earth, or using the Google Maps Labs LatLng Marker). Enter the name of a city or town, though, and it will give you a fairly arbitrary location in that place.
- Final envelope is fairly small in size (~4-7/8” x 3-3/8”; 12.5 cm x 9 cm)
- You’ll probably get the best results (and the most rugged envelope) using photo matte paper.

