Many smartphones come with geotagging turned on as a default; if the phone has a good position fix from GPS or cell tower data, it will embed these coordinates into the EXIF header of the photograph.This is my preferred setting, but there are times when I want to remove this data, to protect the location where a photo was take. The free Windows program Geotag Security will remove the embedded coordinate geotagging data from all photos in a folder, while leaving the other EXIF data (date, time, exposure info, camera, focal length, etc.) untouched. Just select the folder with the photos you want to have scrubbed, and it does the job automatically:
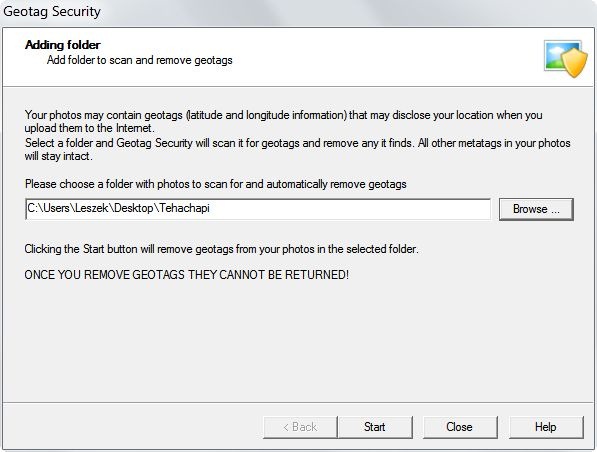
As the caution above indicates, once the coordinate geotags are removed, they’re gone for good. So if you want to preserve the original geotagging data somewhere, you should first make a copy of the folder with your photos, and scrub the geotag data only out of the copy.
A $20 Pro version of Geotag Security is available that will monitor folders, and automatically scrub their geotagging data as you download them from your phone or camera.
Via Lifehacker.
Note: The Android app GeoEraser can also remove geotag data from a photo, but creates a new scrubbed photo, keeping the original unchanged.
The US Department Of Agriculture’s Natural Resources Conservation Service (NRCS) – National Cooperative Soil Survey has a Web Soil Survey site that lets you query and access US soil data, but I’ve always found it slow and difficult to use. The California Soil Resource Lab at UC-Davis has created the SoilWeb data service, which recasts this data into a number of easier-to-use formats:
- A Google Maps interface, which allows direct access to more detailed information for a soil unit. Scroll/zoom to an area, and see soil units plotted on the map, with a dynamic legend at right:
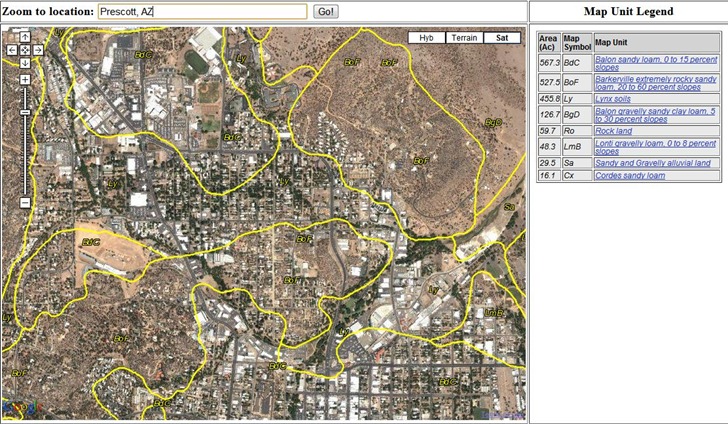
Click on a link to open a new page with links to more detailed info:
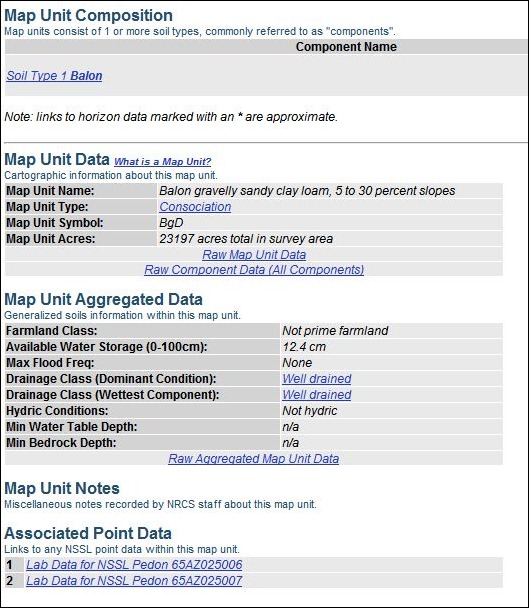
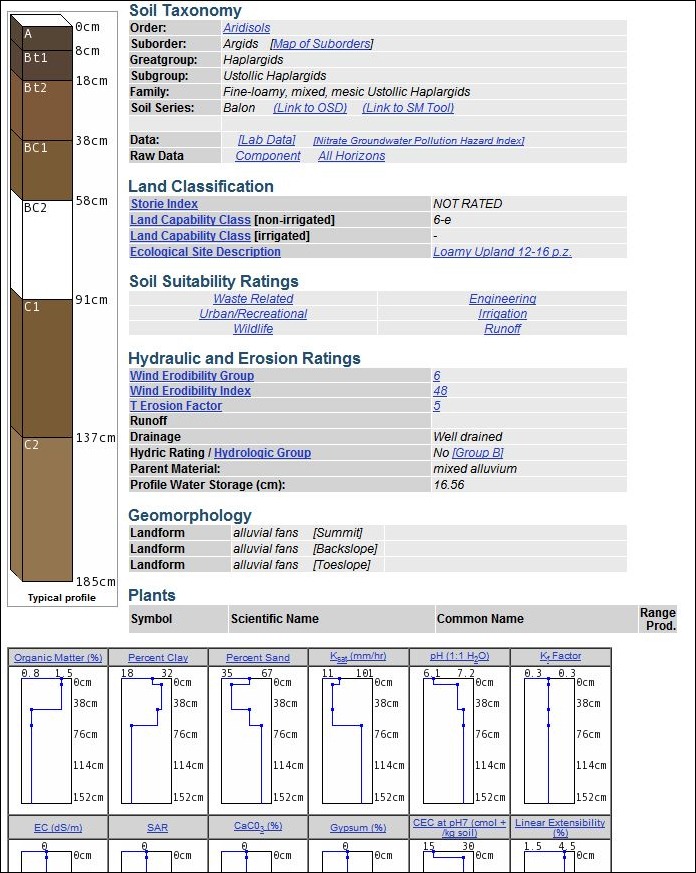
For example, clicking on the “Soil Type 1 Balon” link brings up a data page with the soil column, taxonomy, common vegetation types (if available), plus lots more:
- Smartphone apps for both iPhone and Android, so you can view comparable soil data out in the field if you have Internet connectivity and a GPS position fix. See my review of the Android app here.
- A text-only interface
- A Google Earth file that offers similar maps and links to the Google Maps interface, but which I find less convenient to use.
- And a HTTP SoilWeb API that allows for text-based and WMS queries
Over the Thanksgiving Day weekend, the Quantum GIS blog announced the release of the latest version of qGIS, 1.6. Along with gvSIG, qGIS is one of the premier free multi-platform GIS programs (and unlike qGIS, gvSIG hasn’t yet created a Mac version of their latest release, 1.10). Extensive change list from the last version (from the blog post):
General Improvements
- Added gpsd support to live gps tracking.
- A new plugin has been included that allows for offline editing.
- Field calculator will now insert NULL feature value in case of calculation error instead of stopping and reverting calculation for all features.
- Allow user specific PROJ.4 search paths and update srs.db to include grid reference.
- Added a native (C++) raster calculator implementation which can deal with large rasters efficiently.
- Improved interaction with extents widget in statusbar so that the text contents of the widget can be copied and pasted.
- Many improvements and new operators to the vector attribute table field calculator including field concatenation, row counter etc.
- Added –configpath option that overrides the default path (~/.qgis) for user configuration and forces QSettings to use this directory, too. This allows users to e.g. carry QGIS installation on a flash drive together with all plugins and settings.
- Experimental WFS-T support. Additionally ported wfs to network manager.
- Georeferencer has had many tidy ups and improvements.
- Support for long int in attribute dialog and editor.
- The QGIS Mapserver project has been incorporated into the main SVN repository and packages are being made available. QGIS Mapserver allows you to serve your QGIS project files via the OGC WMS protocol. Read More
- Select and measure toolbar flyouts and submenus.
- Support has been added for non-spatial tables (currently OGR, delimited text and PostgreSQL providers). These tables can be used for field lookups or just generally browsed and edited using the table view.
- Added search string support for feature ids ($id) and various other search related improvements.
- Added reload method to map layers and provider interface. Like this, caching providers (currently WMS and WFS) can synchronize with changes in the datasource.
Table of contents (TOC) improvements
- Added a new option to the raster legend menu that will stretch the current layer using the min and max pixel values of the current extent.
- When writing shape files using the table of contents context menu’s ‘Save as’ option, you can now specify OGR creation options.
- In the table of contents, it is now possible to select and remove several layers at once.
Labelling (New generation only)
- Data defined label position in labeling-ng.
- Line wrapping, data defined font and buffer settings for labeling-ng.
Layer properties and symbology
- Three new classification modes added to graduated symbol renderer (version 2), including Natural Breaks (Jenks), Standard Deviations, and Pretty Breaks (based on pretty from the R statistical environment). Read More
- Improved loading speed of the symbol properties dialog.
- Data-defined rotation and size for categorized and graduated renderer (symbology-ng).
- Use size scale also for line symbols to modify line width.
- Replaced raster histogram implementation with one based on Qwt. Added option to save histogram as image file. Show actual pixel values on x axis of raster histogram.
- Added ability to interactively select pixels from the canvas to populate the transparency table in the raster layer properties dialog.
- Allow creation of color ramps in vector color ramp combo box.
- Added “style manager…” button to symbol selector so that users will find the style manager more easily.
Map Composer
- Added capability to show and manipulate composer item width/ height in item position dialog.
- Composer items can now be deleted with the backspace key.
- Sorting for composer attribute table (several columns and ascending / descending).
The Mapserver support is intriguing; edit a qGIS project, and have a WMS server publicly accessible to display that project fully up-to-date.
In related news, the Linfiniti blog has rendered a PDF version of the Python qGIS cookbook (PyQGIS for short); download it here.
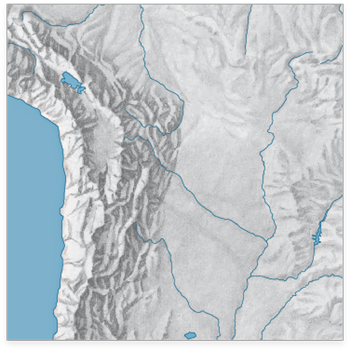
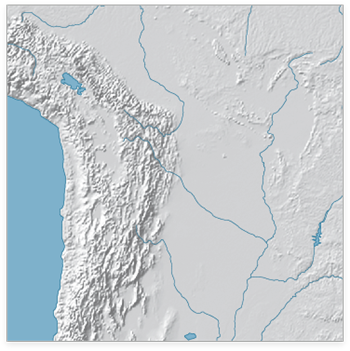
The WeoGeo blog highlights the Shaded Relief Archive, a collection of hand-shaded relief maps freely usable and distributable. This is a joint effort from Tom Patterson, creator/manager of the Natural Earth Data website (see this post for more info on the latter site), and Bernhard Jenny (author of the Terrain Bender and Scree Painter tools). While you can generate shaded relief from digital data (using reflectance), hand-shading can often do a better job of highlighting subtleties of terrain detail, as in this comparison of hand-shaded data (left) and digitally-derived data (right) taken from the Shaded Relief Archive comparison page:
Some maps come in georeferenced GeoTiff format (along with shapefiles that define map area and coastlines); others have yet to be georeferenced. Most are at fairly small scales, so they’ll be best for maps covering large areas; an exception is the set of 100+ shaded relief maps for US National Parks.
Note: Some of these shaded relief maps, as well as many others, are also available at the WeoGeo Market site.
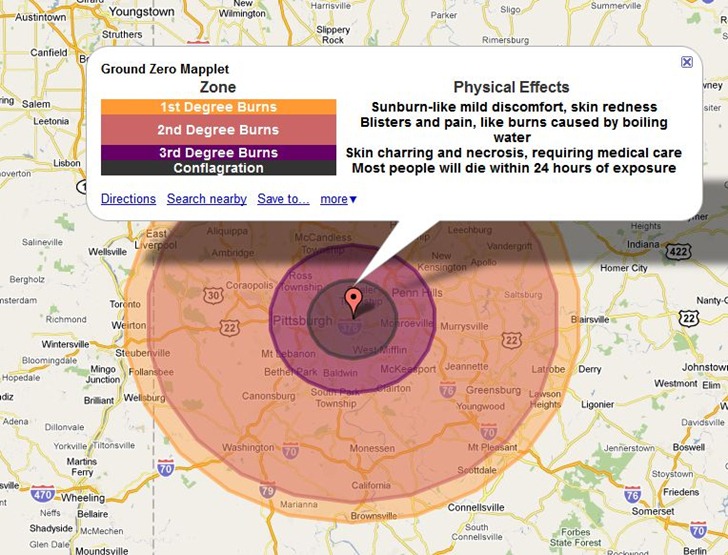
Bit of a grim app, but the CarlosLabs Ground Zero Mapplet will show the effects of various-sized nuclear weapons on a number of preset world cities. Here’s the impact on Pittsburgh of the “Tsar Bomba” blast, the most powerful nuclear weapon ever tested at 50 megatons:
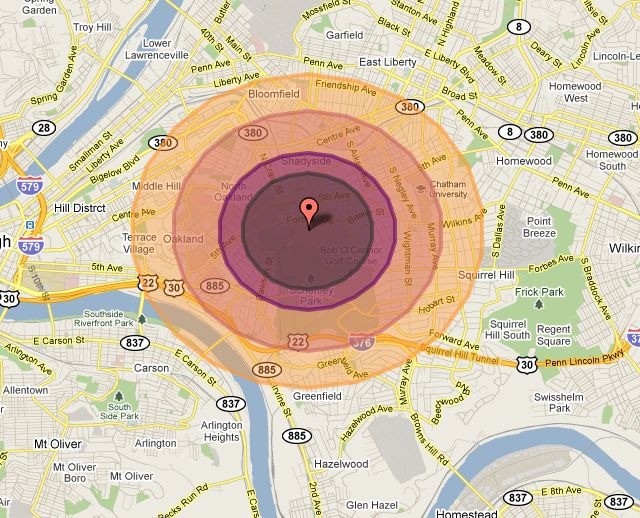
Most other blast options are for much less, like the 15 kiloton “Little Boy” dropped on Hiroshima:
But the largest explosion model available is an asteroid impact comparable to the Chixculub impact 65 million years ago that caused dinosaurs to go extinct:
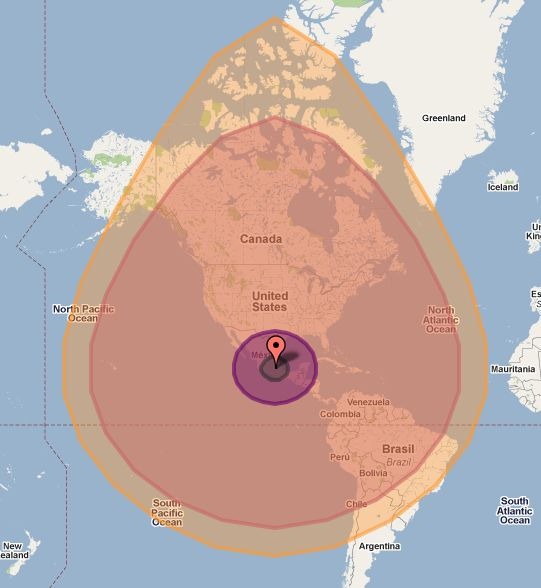
The main version is a Google Maps Mapplet, so you’ll need a Google account to use it in your My Maps collection. There’s a direct link to install it into My Map at the CarlosLab website. The Maps API link will take you to a page with embeddable code that lets you put a comparable app into your web page, like the live example below:
Unlike the Mapplet, the embedded app lets you select any location, but the overall map size is constrained. Source code for this app is available at the link above.
I’ve linked to sources for magnetic declination, the difference between true north and magnetic north, in the past. But for the current value, the Magnetic Declination website may be the easiest to use. When you visit it, it will determine your location based on your IP address, and give you a Google Map view with pop-up showing magnetic field data for your position, including the declination. But you can also scroll the map to any location, click on it, and get comparable data for that spot:
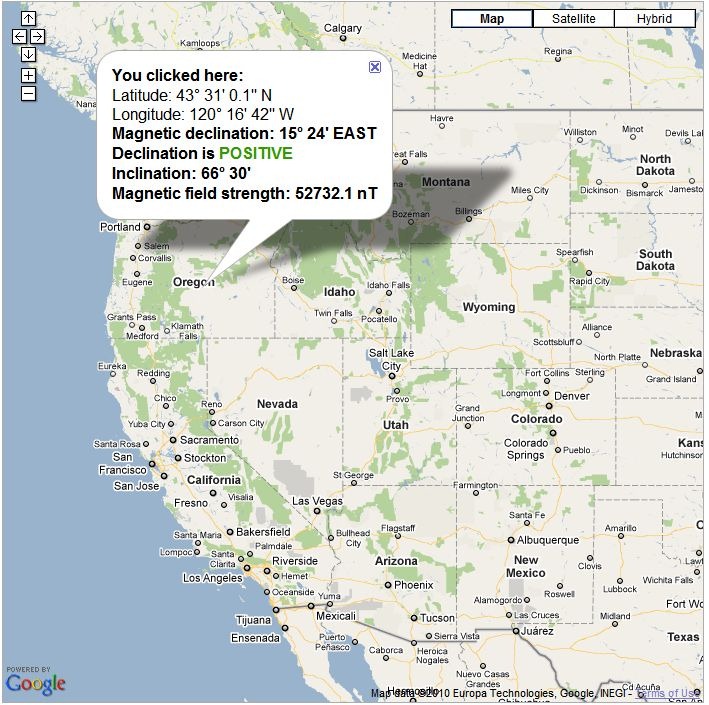
To correct a magnetic compass bearing to a true bearing, add the magnetic declination if it’s described as POSITIVE (as above), subtract it if it’s negative. I do wish it gave values in decimal degrees, but it’s not too hard to convert DM to decimal (divide minutes by 60, add to the degrees).
Inclination is the angle of the magnetic field relative to the surface at that point; good compasses often have the needle weight balanced to compensate for the magnetic field angle, which otherwise would cause the needle to skew forward or back. Since the angle shifts from positive to negative as you go south across the “magnetic equator”, this needle balancing is usually optimized for either the Northern or Southern Hemisphere for a particular compass. More expensive compasses are available with balancing systems that will work across most of the globe.
Not long ago, I posted about Another Earth, a site that loads two Google Earth views side-by-side, and lets you either view two locations separately for comparison, or synchronize movements between the two. I said that it was very useful as-is for comparing geographical features, but would be awesome when it added the ability to view historical imagery in one window, and compare it with current imagery in another. John at Another Earth just emailed me to say that the historical imagery option is now active at the site. You’ll need to make sure that the time sliders are enabled for one or both Google Earth windows in the Control Panel (layout is slightly modified from the previous version):
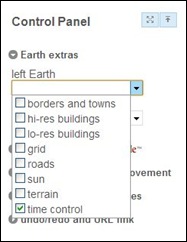
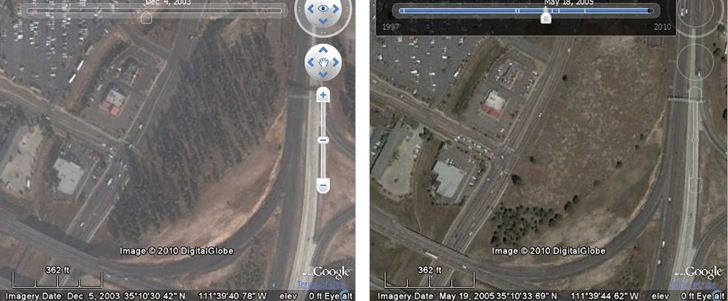
Then move the time sliders to an available imagery date; tick marks in the slider panel mark dates with available imagery. In the sample below, I compare a wooded knoll on the left from 12/2003 with a later view in 5/2005, after the owner had illegally chainsawed through the tree trunks to kill them, and clear out the lot:
Here’s another comparison near Bandon, Oregon, showing growth of cranberry bogs between 1994 and 2010:
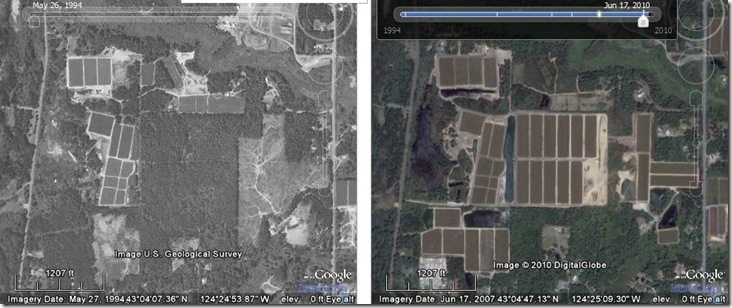
You’re restricted to whatever imagery Google Earth has available for that area for a particular time, which for much of the US doesn’t seem to go earlier than the 1990s. Still, this is pretty awesome as-is for looking at man-made landscape changes or the effects of natural disasters, and will only get better with time as Google adds more historical imagery to their database.
The Live Real Time Satellite Tracking page lets you select a satellite, or groups of satellites, and plot their position in a Google Maps interface. You can select all types of a particular satellite currently visible from your location, and plot them along with the satellite’s visibility footprint (Iridium satellites here):
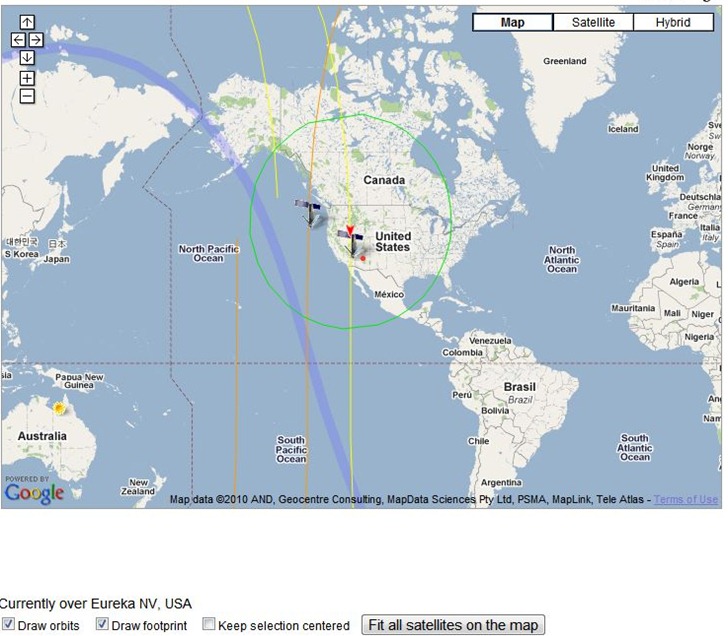
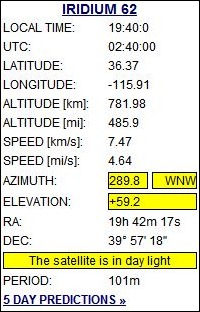
The graphical view updates in real-time, so you can see the satellite’s position change. A display shows you the current visibility parameters for the selected satellite:
You can select from lists of satellites with a single click:
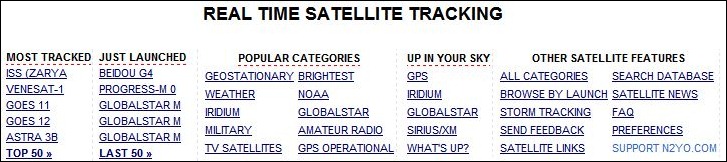
And then select from a list of satellites (GPS operational here) to choose which one to track.
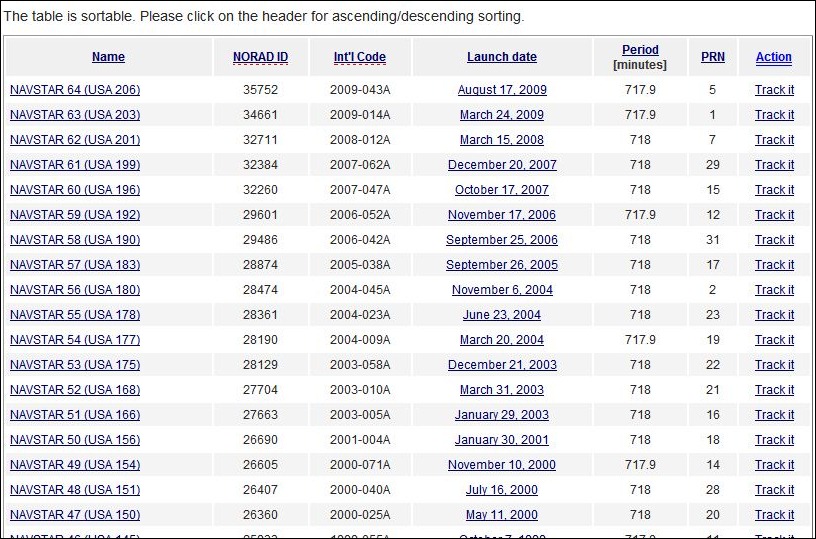
Clicking on the satellite name brings up additional info about the satellite:
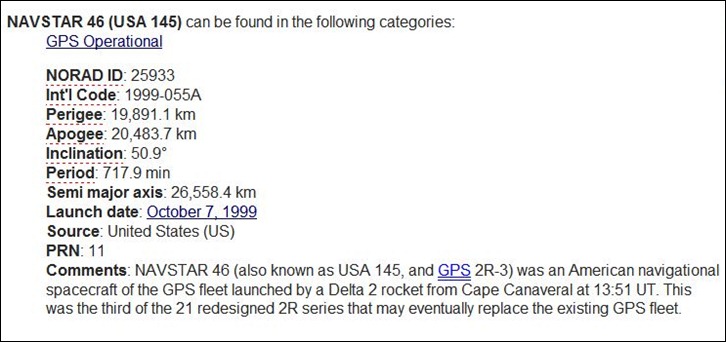
With the “Up In Your Sky” links, you’ll have the option of selecting multiple satellites, including all of them in a particular category.