blankblank blank


Archive for the 'Web apps' Category Page 4 of 10


Compare Geographic Boundaries With Move Outlines

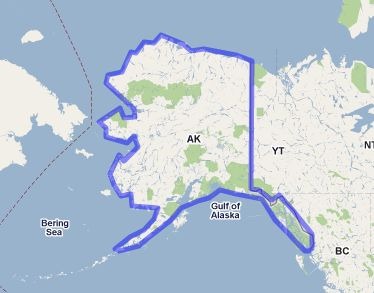
I can remember as a kid (way too many years ago) being impressed with a map of the lower 48 United States that had the outline of Alaska superimposed on top of it. The Alaska outline virtually covered the entire map, and there was a comment to the effect that,”Alaska is almost as large as the lower 48 states”. It wasn’t until years later that I realized the creator of that map had just traced an outline of Alaska off of a Mercator projection map and laid it on top of the US map without compensating for the change in scale.

If only the map maker had had access to  Mapfrappe’s Move Outlines site, he might not have made that mistake. Draw an outline of a geographic area in one Google Maps window:

tracedoutline

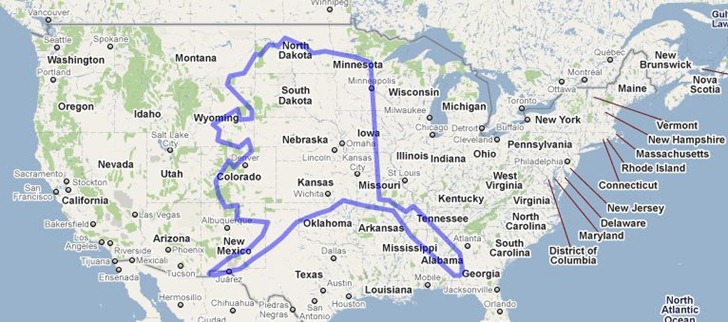
And have the outline be superimposed on top of another Google Maps window, scaled correctly to compensate for changes in the Mercator scale at different latitudes:

superimposed

Alaska’s still pretty dang big, but this shows it at its true scale, roughly one-third the size of the lower 48.

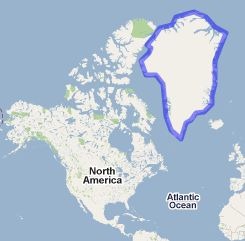
Another classic example of this is Greenland, which looks humungous on a standard Mercator projection:

greenlandoutline

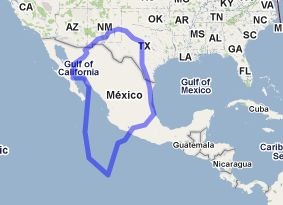
In true area, though, it’s roughly the same size as Mexico; big, but not gargantuan:

greenmex

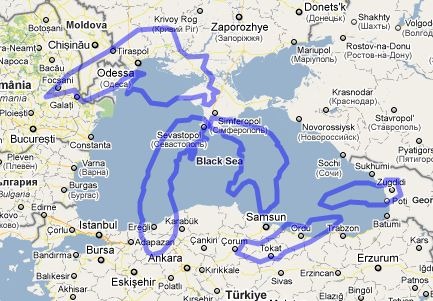
The site has some pre-drawn comparisons, like the Great Lakes against the Black Sea:

greatlakesvsblacksea


Draw A Polygon In Google Maps, Get The Enclosed Area

With the Google Planimeter site, click on the map to add polygon points:

nmpoints

And have the area enclosed by the points be calculated in multiple units:

areas


Find Your Own Double Rainbow – So Intense

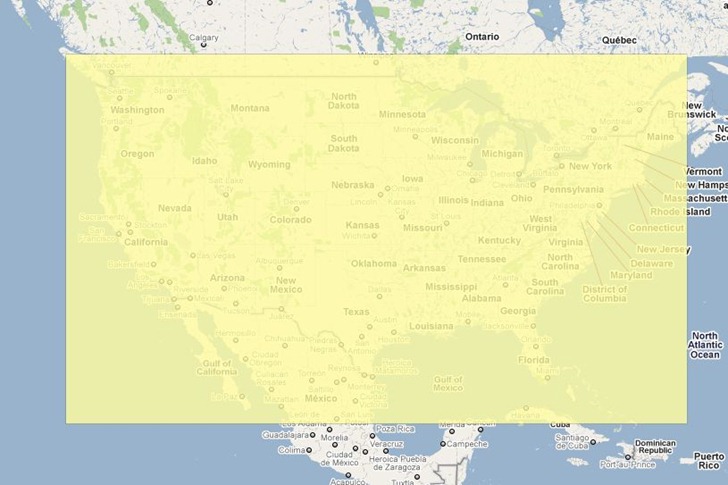
One of the more interesting Google Maps mashups I’ve seen in a while, OMGRainbows! mixes information about where it’s raining in the United States along with the angle of the sun, and plots areas where you’re most likely to spot rainbows. To see a rainbow, you need to have the sun behind you, shining towards an area where there’s rain falling. If the sun angle is too high, you’ll a solid yellow overlay:

norainbows

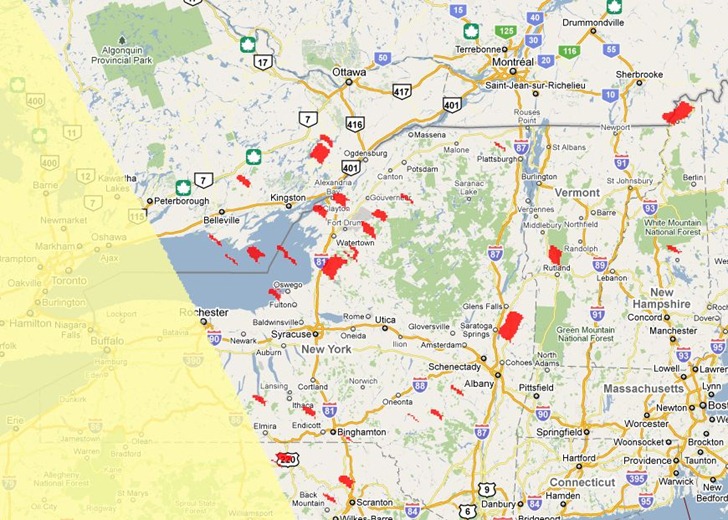
But if the sun angle is acceptable, you’ll get a plot in red that shows the areas where you could see a rainbow if the sun is visible:

rainbowzones

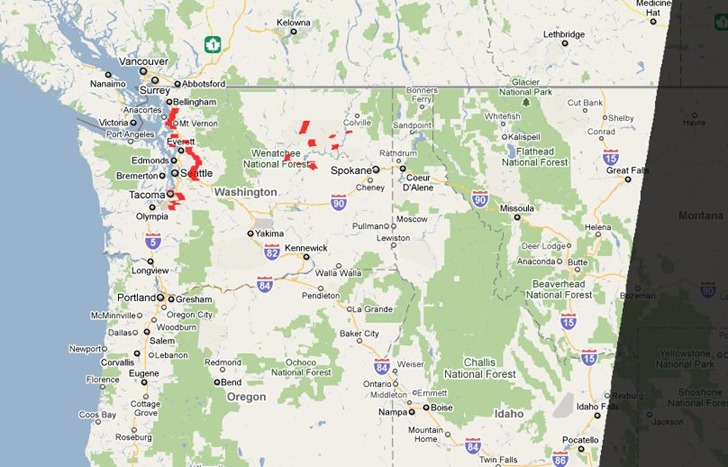
And when night falls, you’ll get a dark overlay showing where there’s no sun to generate a rainbow:

rainbownight

And if you don’t understand the post’s “intense” title:

Via GoogleMapsMania.


The Global Peace Index Map

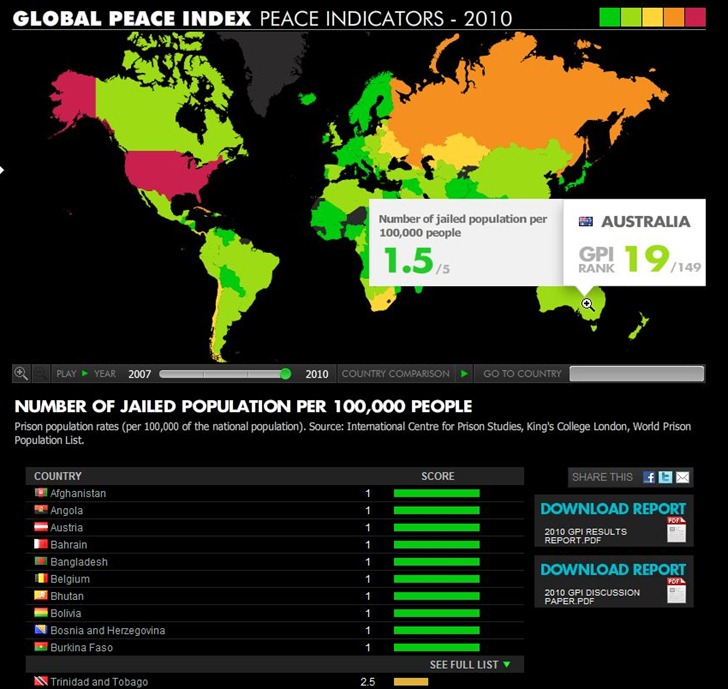
Vision Of Humanity’s Global Peace Index Map displays a choropleth view of the “Global Peace Index” (GPI), a quasi-arbitrary composite index of 23 factors like military expenditure, level of violent crime, number of heavy weapons, and more. More meaningfully, you can also select individual factors for display on the map, along with a time slider that shows how they change from 2007 to 2010; passing your cursor over a country brings a pop-up with the country rank for that factor, along with the GPI rank. There’s also a table at the bottom listing countries listed by factor ranking; you can also download a PDF with a summary of the general data. Here’s the jailed population factor, number of jailed population per 100,000 people:

gpimap

USA is #1! But not in a good way …

There’s a list of 32 “Related Indicators”, economic/demographics/societal, you can plot as well, including some unusual ones like “Hostility to foreigners” , “Willingness to fight”, and “Corruption perceptions”. Coming soon is another section of “Stats on Life”, containing additional factors like “Water availability” and “Government efficiency”.

Via Download Squad.


Crowdsourcing And Coordinating Data Collection With Handheld GPS Units

Got an email today from someone with a data collection/coordination/assembly problem. They have multiple people out in the field with Garmin GPS units recording data, and bringing it back to a central location for collation/combination when they’re done. Since Garmin GPS units have limited capabilities for data storage – coordinates, name, comment, date and time, elevation, and that’s pretty much it – additional data associated with a point has to be recorded by hand. Once back from the field, data has to be downloaded from individual units, associated with the additional attribute data from forms, all the data combined together into a single dataset, then converted into GIS-friendly format. And the process they had come up with wasn’t really working well for them.

I think this highlights some of the major limitations of classic stand-alone handheld GPS units. They’re really designed for us in personal data collection, not combined data collection; assembling data from multiple units can take a lot of work. Plus, their limited data collection capabilities require offloading data attribute acquisition to other formats (e.g. pencil and paper), adding the addition problem of associating that data with coordinates later on. There are lots of professional solutions for these problems, like Trimble or MobileMapper GPS units, Terrasync and ArcPad software, but these can be complicated and expensive. I challenge you to find anyone with enough patience to use Terrasync for a single day without swearing at least once; I know I can’t  ;-).

For a few years, I’ve had CyberTracker on my list of potential topics to post on. CyberTracker is a terrific data acquisition and collation tool for field data with tons of great features, like custom data acquisition form design for easy data entry, moving maps, easy data collation and conversion to GIS-friendly format. Plus, the software is free, and the hardware is (relatively) affordable. But unfortunately, I think time and technology are passing Cybertracker by:

  • While the central data software runs on Windows, the field data collection software runs on old-school Palm OS and Windows Mobile. Palm OS is dead; Windows Mobile development has stopped with version 6.5, and only maintenance updates are scheduled. So the useful lifetime of any data collection system built around CyberTracker is limited. If you need a fast/cheap/short-term solution, CyberTracker is free for non-profit use, and you could probably pick up the hardware very cheaply on eBay. Long-term, I don’t see it having much of a future in its current form.
  • The data collation model is also becoming obsolete. With CyberTracker, you have to bring all the data units to a single data download/collation computer. While there are still places in the world where this might make sense, an increasingly-connected world means that data download/collation to the cloud instead of an individual computer makes more sense.

I’m really excited about the possibilities for crowdsourced geographic data collection and collation using portable devices running Android OS (yeah, iOS too). There are already several interesting apps for doing this, and I hope to cover some of those soon on my AndroGeoid website. And I suspect that the small number of apps that can currently do this will be quickly joined by far more apps, and far more capable apps, in the very near future. But that doesn’t help with my emailer’s current problem. I suspect there are many different ways you could do this, but here’s the first approach that came to me using all-free software and services.

1. Make sure that everyone on the project has a Google account (i.e. Gmail); completely free.

2. Have the project leader created a single main data spreadsheet on Google Docs, with all the desired data attributes (e.g. point name, coordinates, comments, additional data fields from the paper forms, etc.) and share a link to that spreadsheet with other project members so that they can edit it as well.

3. Project members can download data from their Garmin units using DNRGarmin, and then export the data from DNRGarmin in CSV format.

4. Load the data into the spreadsheet program of your choice, and add/edit data from data forms to make it conform to the data structure of the main Google Docs spreadsheet.

5. Copy the data cells in the spreadsheet program, and paste them into the main Google Docs spreadsheet. Note: Use Ctrl-C and Ctrl-V to copy and paste cells into Google Docs instead of using the Google Docs Edit menu to perform those operations, as the latter doesn’t seem to work for pasting data from different applications into Google Docs. You no longer have a single computer as a choke point for data entry; multiple people can add data to a spreadsheet at the same time, and Google Docs will coordinate data entry so that nothing is lost. And if you save the spreadsheet data from steps 3 and 4 as separate files, you’ll have backup copies of the original data as well.

For those who aren’t comfortable with working with spreadsheets, Google Docs lets you set up a “Form” to let anyone add data to a Google Docs spreadsheet directly; however, this increases the chances of coordinate data entry error.

6. Now that you have all the data centralized in Google Docs, you have lots of flexibility in how you can handle it:

  • Export the data in CSV format, and you can then import it into any GIS program that supports CSV data. If your GIS program doesn’t, use MapWindow to convert your CSV file into shapefile format first.
  • Unlike shapefile attribute tables, where adding/removing/re-ordering attribute data columns can be a pain, you can easily perform those operations in Google Docs and then re-export the data in CSV format.
  • Convert the data directly into a continuously-updated KML network link for display in Google Earth or Maps using Google’s Spreadsheet Mapper tool.
  • Use any of Google Docs built-in tools to analyze/plot/sort/visualize data, including their way-cool Fusion Tables.
  • And I’m sure there are more options I haven’t thought of.

Know an alternate approach? Have any additional ideas?  I welcome your links and suggestions in the Comments section below.


Do-It-Yourself Aerial Mapping At GrassrootsMapping.Org

The Grassroots Mapping wiki collects information, how-tos, current projects and general resources for creating your own georectified aerial imagery using cheap hardware to acquire the imagery (balloons, kites, and UAVs). Check out the main site for blog entries on current projects as well. From the website:

Seeking to invert the traditional power structure of cartography, the grassroots mappers used helium balloons and kites to loft their own “community satellites” made with inexpensive digital cameras. The resulting images, which are owned by the residents, are georeferenced and stitched into maps which are 100x higher resolution that those offered by Google, at extremely low cost. In some cases these maps may be used to support residents’ claims to land title. By creating open-source tools to include everyday people in exploring and defining their own geography, Warren hopes to enable a diverse set of alternative agendas and practices, and to emphasize the fundamentally narrative and subjective aspects of mapping over its use as a medium of control.

One of the resources highlighted is the Cartagen Knitter, a simple online application for knitting together multiple aerial images into a single one for georeferencing using GIS software or an online service like Map Warper. Here’s a video demo:

Cartagen warping tool demo from Jeffrey Warren on Vimeo.

More related videos here.


Draw And Edit Google Maps My Maps Layers With DRAWaMAP

Joining quikmaps and ScribbleMaps, DRAWaMAP lets you draw features in a Google Maps interface, and save them. Supported features include:

  • Lines
  • Markers
  • Polygons
  • Time polygons – you set a time and speed, and DRAWaMAP draws a polygon encompassing the walking distance around that point based on Google Maps data.
  • Map Density Quadtree – ? Not sure, but it seems to create an editable polygon feature based around a starting and ending point.
  • Adjustable fill color / feature opacity.

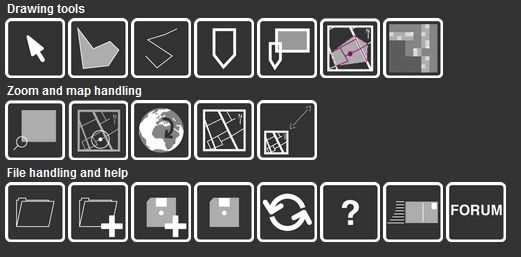
Data import/export/editing features are very limited compared to quikmaps and ScribbleMaps, but unlike those two, DRAWaMAP lets you import or export data directly from/to Google Maps MyMaps. The symbology/iconology used in DRAWaMAP is substantially different than that used in MyMaps, which takes some getting used to; controls are a bit cryptic as well:

drawamapcontrols

There’s a help button that brings up short, helpful video tutorials for some of these, but others will require experimentation to figure out. But to view these help videos, make sure you enable allow pop-ups from the DRAWaMAP site; otherwise you may wind up wasting time by pushing the help control buttons multiple times to no effect before figuring it out (like I did :).  As the videos demonstrate, this AJAX app’s interface is designed to make it usable on a mobile phone, making it a decent alternative to the main Google Maps MyMaps web-based editor on those devices.

Via GoogleMapsMania.


Multiple Coordinate Systems In Google Maps, Reverse Geocoding, And More With The Worldwide Coordinate Converter

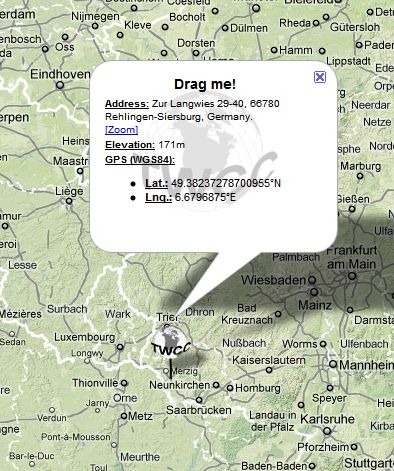
Clement Ronzon emails about his new website, The Worldwide Coordinate Converter (TWCC for short). Drag the globe-shaped icon to the desired location in a Google Maps interface, and get a pop-up balloon with the geographic coordinates for that spot, elevation in meters, and the nearest reverse-geocoded address:

twccballoon

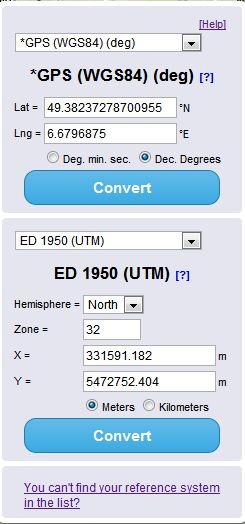
At right is a two-part coordinates box, with latitude/longitude/WGS84 always in the top part, and a user-selectable coordinate system at the bottom:

coordschooser

You can also enter coordinates into the appropriate boxes in either the top or bottom section, click Convert, and have them converted to the other coordinate system automatically (and plotted on the map).