Joining quikmaps and ScribbleMaps, DRAWaMAP lets you draw features in a Google Maps interface, and save them. Supported features include:
- Lines
- Markers
- Polygons
- Time polygons – you set a time and speed, and DRAWaMAP draws a polygon encompassing the walking distance around that point based on Google Maps data.
- Map Density Quadtree – ? Not sure, but it seems to create an editable polygon feature based around a starting and ending point.
- Adjustable fill color / feature opacity.
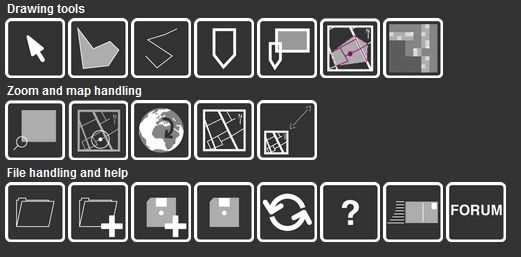
Data import/export/editing features are very limited compared to quikmaps and ScribbleMaps, but unlike those two, DRAWaMAP lets you import or export data directly from/to Google Maps MyMaps. The symbology/iconology used in DRAWaMAP is substantially different than that used in MyMaps, which takes some getting used to; controls are a bit cryptic as well:

There’s a help button that brings up short, helpful video tutorials for some of these, but others will require experimentation to figure out. But to view these help videos, make sure you enable allow pop-ups from the DRAWaMAP site; otherwise you may wind up wasting time by pushing the help control buttons multiple times to no effect before figuring it out (like I did :). As the videos demonstrate, this AJAX app’s interface is designed to make it usable on a mobile phone, making it a decent alternative to the main Google Maps MyMaps web-based editor on those devices.
Thanks for giving a short review of DRAWaMAP on this blog
Sorry for the cryptic buttons, I tried to make them more like buttons from CAD programs.
I will add new help videos soon.
The Quadtree feature is a way to create density maps from markers on the map …
When markers are closer to each other the density map will be red, where they are fare apart it will get blue.
There are some new features just added.
Hope that helps.
thx
DRAWaMAP