blankblank blank


Archive for the 'Google Maps' Category Page 5 of 15


Thematic Data In Google Maps With Plug And Play Maps

Chris Duncan writes to let me know about his online mapping tool/service, Plug and Play Maps (slogan: “Just Add Data”), that lets you take data in number of formats:

  • Spreadsheet/text (CSV)
  • JSON string
  • DBF
  • KML
  • Shapefile
  • Web database

And display it as a thematic map in Google Maps, with colors/shapes representing thematic values (with limitations for some formats like KML and shapefile). Some live examples shown on the website include:

Continue reading ‘Thematic Data In Google Maps With Plug And Play Maps’


Digipoint, Export Of Google Maps Point Coordinates, Upgraded To Version 3

I’ve posted before about Digipoint (version 1 and version 2), a web app that lets you select points in a Google Maps interface, then export their coordinates in a variety of formats. Version 3 of Digipoint is now out, with some modest improvements:

  • A new interface, a bit easier to use, and which works better in browsers where the default font size has been modified
  • Fly-to: Specify an address, country, or location, and the map will automatically go there. There are also a limited number of pre-specified country/region links, where  clicking on the link takes you to the area automatically
  • In previous versions, you had to copy/paste text for a particular export format like CSV or KML; you can now download the file automatically
  • For exported shapefiles, a corresponding prj file is also created to specify the coordinate system (your choice of geographic or UTM; WGS84)
  • Help section added

Still supports the same export formats as before: CSV, TXT, TAB, BLN (Surfer), GPX, KML, DXF and shapefile. Versions one and two are still available if you want them, but there’s no good reason to use them anymore.


MapChannels Updates To Version 3

MapChannels (covered several times before on this blog) has announced version 3 of their embeddable Google Maps data tools. New features include:

• Restructuring of the design process
• User-definable dictionaries to present maps in any language
• Support for spreadsheet data in either tab-delimited format or from Google Spreadsheets
• Support for GeoRSS feeds using the Google Feeds API
• Marker clustering to display large numbers of markers on a map
• Google Street View
• Microsoft Virtual Earth

I’ve played with a bit, and it is easier to use than Version 2 (which is still available). Especially nice is the Google Spreadsheet feature; while Google had a “wizard” that walked you through one way of doing this before, the MapChannels method is far easier to use, and the ability to add GeoRSS feeds and other data makes it more powerful.


Another New MapChannels Feature: Geography Quiz Maps

In addition to the new TeamMaps feature, MapChannels has a new embeddable geography game called QuizMaps:

Choose World or State Capitals, and get a world/US map with letters plotted at various locations, as in the example screen capture below:

MapChannels geography quiz

Unscramble all the letters to get the correct answer; one of the letters is plotted at the same location as the answer. Panoramio photo clues from the answer location can show up on the left, but are usually as useless as the example you see above. The correct answer to the image above is left as an exercise for the reader.


Visitor-Editable Google “Team Maps” At Map Channels

The MapChannels website has a new feature called “Team Maps”, which lets you create an embeddable Google Maps view which visitors are free to add their own annotated markers to. From the website, features include:

  • (1) Create a new empty Team Map, (2) create a map from an existing KML or (3) create a map using a pre-defined event venue map data
  • Customizable data schema – allowing you to define a set of data fields for your place markers
  • Customizable info window and tooltip contents – use javascript template code to format your data schema
  • Pre-defined javascript template functions to display images, YouTube videos, website thumbnails and RSS feeds within info windows
  • Define the set of icons that can be used for map markers
  • Optionally select other Map Channels users to be an admin or editor for your map
  • Review user edits before applying any changes to your map
  • Lock the map to disable map editing by users
  • Automatically generate KML, GeoRSS and Tab-delimited text feeds for your map data
  • Import data from KML files (e.g. Google My Maps) or tab-delimited text (Spreadsheet) files
  • Embed your Team Map into a web page using a single line of HTML code. This code uses an IFrame, the URL within the IFrame can include parameters allowing you to display a specific place on the map (plus other options).

Here’s a simple active  map I created to test the service. The initial display bounds for the map are set automatically by the loaded data; for this map, I’ve added two placemarks already to set those bounds:

As a viewer of the map, you can submit a placemark for entry on this map using the “Add Place” link at the upper right; it lets you add not just a marker, but also a name, description, web link, and note for the map creator/editor:

1-7-2009-10.43.05 PM

You position the marker by dragging it on the map to the desired location. Once done, click on “Complete”, and your placemark is submitted to the map’s creator for review and approval before it shows up on the map. Feel free to add a placemark to the above map to try it out, but don’t look for it to show up – I won’t be reviewing/approving any submissions on this test map.

Current limitations (from the website):

  • Only markers (points) can be added to a Team Map. Lines and polygons are not yet supported
  • Team Maps are suitable for map collections of up to 500 markers, performance will be affected when you use a larger number of markers.
  • Please contact (MapChannels) if you are getting more than 5,000 page views per day for maps, this assists in planning server resources.


Tiny Geocoder

Tiny Geocoder is a small, simple web geocoder; type in an address or geographic location, and get back the approximate latitude/longitude for that location, and a Google Map view with that location plotted:

12-1-2008-10.03.26 AM

If you have a Google Map API key (free), you can generate code to create a static link to this map (static meaning just the image itself, not scrollable or zoomable).

And for web gearheads, there’s a simple and free API available for geocoding and reverse geocoding. Here’s an example of geocoding for Provo, Utah, and reverse geocoding for 37,-110.


Online Traveling Salesman Problem Solver

Wikipedia defines the “Traveling Salesman Problem” this way:

given a number of cities and the costs of travelling from any city to any other city, what is the least-cost round-trip route that visits each city exactly once and then returns to the starting city?

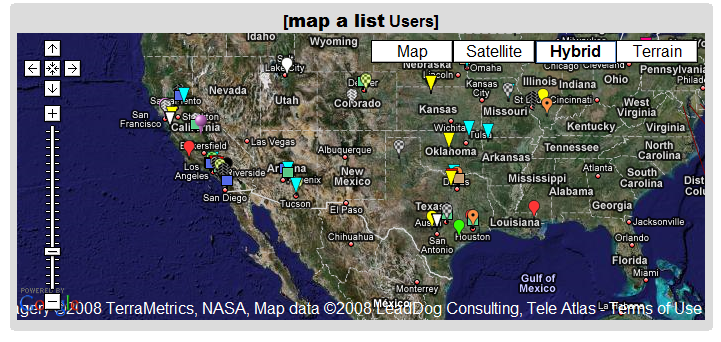
You can substitute “address” for “city”, making this an intra-urban travel problem. The OptiMap website solves this problem automatically for up to 24 locations (“nodes”). You can enter the nodes by clicking in a Google Maps interface:

12-1-2008-7.25.50 PM

You can also enter address nodes individually using the “Add Location By Address” box. Even better, you can add text lists of addresses or coordinates (latitude/longitude) by clicking on the “Bulk add by address or (lat, lng).” link, then copying and pasting the list into the text box that shows up. Latitude/longitude should be in decimal format, one set on each line, separated by commas and surrounded by parentheses, e.g. (35.333, –110.254). You can also specify only walking directions, and avoiding highways. The first node or address entered is always considered to be the starting point.

When you’re done entering nodes, click on “Calculate Fastest Roundtrip” to solve the problem for a round-trip that ends where you started:

12-1-2008-7.26.28 PM

You’ll also get a set of Google Maps driving directions for the trip shown in the solution map. By clicking on the “Toggle raw path output” button, you’ll also get a text list of latitude/longitude coordinates in sequence for this route that you could convert into a GPS route:

12-1-2008-7.32.31 PM

The “Calculate Fastest A-Z Trip” works in a similar fashion, but for a one-way trip, where the first address/node you entered is taken as the start “A”, and the last address/node is the destination “Z”.

The technical background and source code are available on the OptiMap website, as are instructions on how to use this on your own website.


Geocode A Google Docs Spreadsheet And Plot It In Google Maps/Earth With map a list

This is one of the neater online mapping applications I’ve seen in a while. Create a list of addresses and related information in a Google Docs spreadsheet, and map a list will geocode the addresses (convert the address to latitude/longitude), and plot the location and data in a Google Maps interface:

map a list example

You can also export the data as a KML file for use in Google Earth.

  • User-selectable icons
  • Also plots latitude/longitude locations
  • Includes data in other spreadsheet columns in the data bubble
  • Lets you embed images and hyperlinks as well
  • Data can be public or private
  • As you update the spreadsheet, the map data is updated as well (daily, or on demand)
  • Not a lot of documentation, but it’s fairly easy to use, and a healthy number of example spreadsheets will show you how it’s done (scroll through the list at the bottom, and click on the link to see the sample spreadsheet for each list item)
  • Completely free (though they’ll take donations, and offer premium consulting services for a fee)

Definitely worth bookmarking.