

Swivel is a site where anyone can upload data of any kind in tabular or spreadsheet form for general public access, and plot it in a variety of graph formats. Today at Where 2.0, they will announce the new capability of plotting geographic data in Google Maps. See the Webware article for more information and a screenshot. Another more flexible option for this kind of display is Google Map Creator, which creates thematic shapefile maps in Google Maps, but Swivel seems like it may be easier to use.
Archive for the 'Google Maps' Category Page 11 of 15
Ducky Sherwood writes to point out a free new service she’s created called Mapeteria. With Mapeteria, you can take a CSV file (comma-separated values) of data for US States, Canadian provinces, or French departements, and plot them as a choropleth map (color shade depends on the value of the data) in either Google Maps or Google Earth.
You’ll have to put the data in a specific format, but the Mapeteria website has full directions, and it’s a logical and straightforward format. You’ll also have to upload the CSV file to a webserver, and enter the web address for the CSV file on the Mapeteria site. Beyond that are a few more optional parameters to enter:
- Divisor – you can divide your data by population, area, or the default of nothing
- Color mapping -Set the colors for low and high data values
- Descriptive text
- High or low resolution
Then just click on the Give me a KML file! or Show it on Google Maps! button, and you’re good to go. A simple alternative to using GE-Graph.
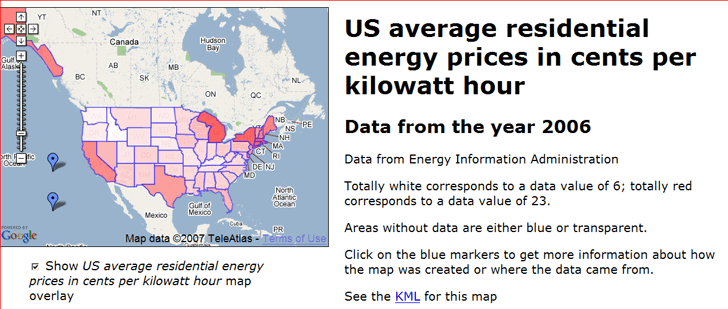
Ducky has some sample datasets to look at in either Google Maps or Google Earth. Here’s the price of electricity for the US in Google Maps:
And here’s the data I’ve always been looking for on French milk production in kiloliters by departement:
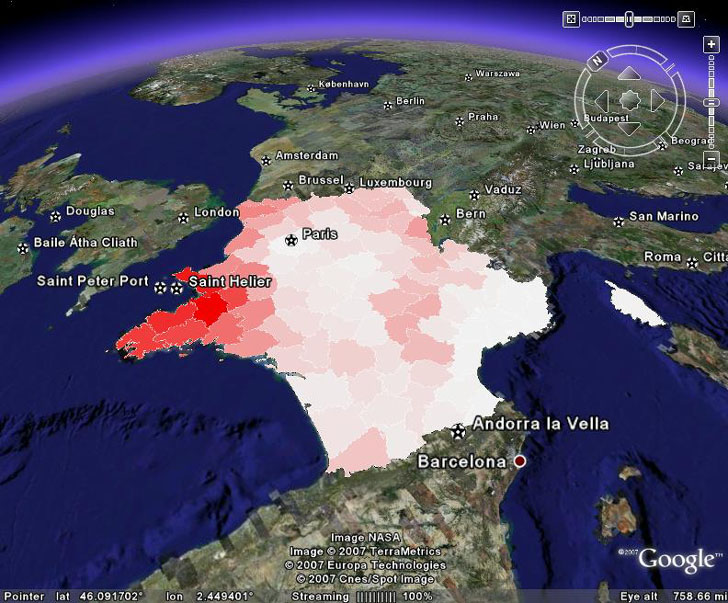
About the only thing I wish it had was an automatic scale marker, but you can always add those in the descriptive text.
More info is available on a posting on the KML Developer Support Group
Thanks, Ducky!
Last week, I posted on how to create an animated depiction of sea level rise due to a storm surge or global warming. Here’s a movie of the flooding for the Manhattan/NYC area:
Got a note from Frank Taylor over at the Google Earth Blog saying that it looked pretty interesting, and that he would have linked to it if it were in Google Earth. That got me to thinking about how you could show the effects of coastal sea level rise in Google Earth with high spatial resolution, both static and animated. I’ll start with the easy one: static.
Continue reading ‘High-Resolution Sea Level Rise Effects In Google Earth’
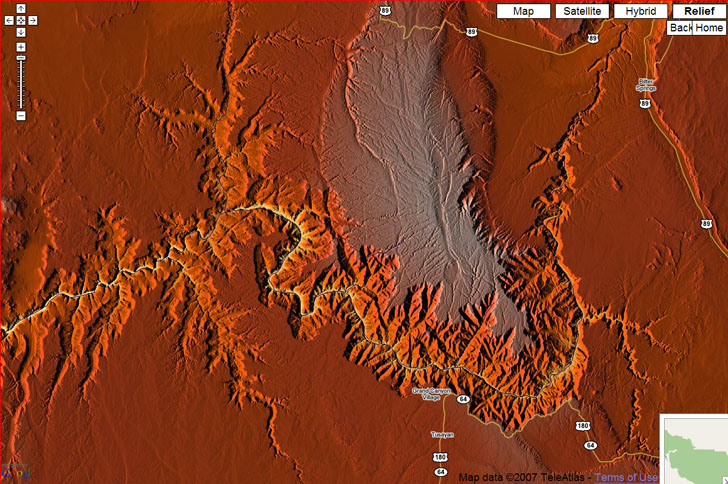
Hans writes to say that they’ve updated their World: Relief Map And Geolocations website, covered in an earlier post. There’s a new button labeled “Maximize”; click on it and the Google Maps view expands to fill your entire screen. Click on it before zooming in; if you click after you zoom, it will zoom you way out again. You can now get some spectacular wide-area colored terrain relief images that you can save with a screen capture program:
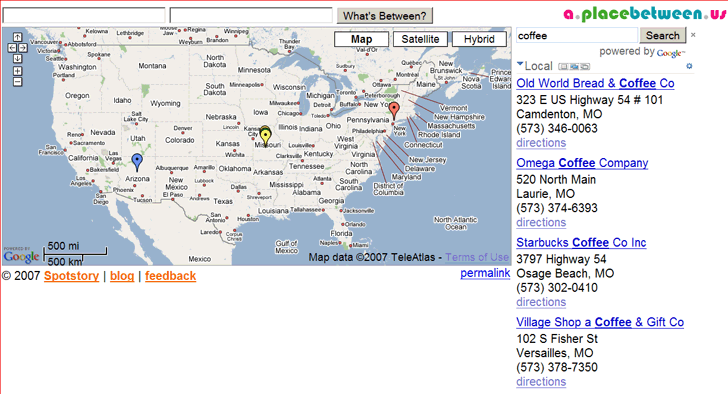
a.placebetween.us takes two locations, finds the spot halfway between them as the crow flies, and plots and lists locations of venues where you can meet in Google Maps (default is coffee, but you can enter a different type of meeting location in the search box looks like it’s mainly coffee houses). So I should meet my brother for coffee in Missouri:
There’s a handy Google Maps site that lets you place a marker, gives you the position, and then lets you convert that position into a number of geographic text formats.
Continue reading ‘Convert A Google Maps Point To Multiple Text Geographic Formats’
In comments from a previous post, TommyBoy writes:
“What I’m looking for and just can’t seem to find; is a simple line plotting tool for Googlemaps. On the weather sites, they’ll say “a storm is expected south of so-and-so to so-and-so to so-and-so. I’d like to pop those cities into a GMap, and have is simply display a straight line connection one city to another, so you can see the storm line. Not following roads and directions, just a point to point to point line. I’ve search high and low, and can’t find anything that simplistic. Ever come across something like this?”
Why yes, I have. Of course, if I hadn’t, I wouldn’t be writing this post :).
The RoutePlanner website allows you to plot routes between locations on a Google Maps interface that you define either by clicking on the map, or entering the location into a search box. For drawing a straight line between two cities, you would do the following:
a. Skip the first step the interface, which zooms in on a location of interest – in most cases the zoom will be at too high a level to be useful.
b. Enter the points you want to draw a straight line between, either by clicking on the Google Maps interface, or entering a location (at least city and state) into the search box. When you enter the first point, it will zoom into that location. Entering the second point will not zoom to that location, though, and you will probably want to zoom out to see both markers on the map.
c. You have two sets of options in the third step on the page. The first is supposed to give you the driving route between the two points, but I can’t seem to get it to work (possibly because of pop-up blocking issues). The other draws a “as the crow flies” straight line between the two points, which is what I think you want. There are two options, “Get Crow Route As Entered” and “Get Best Crow Route”, but they usually seem to give the same results for two points. There are times, though, when one of the “Crow” options doesn’t work, while the other does, and that appears to be a problem with clearing out locations from a previous operation.
d. Once you’re done, you can zoom out to see the line between the two locations, clear everything and Start Over, or even save the points and drawn line in a permanent URL you can bookmark, like this one.
One thing to keep in mind, though, is that only North/South and East/West lines will be “true” in terms of direction. I believe Google Maps uses the “Plate Carree” (“flat and square”) or equirectangular projection, where the grid uses an equal spacing for latitude and longitude degrees in the y and x directions. But on the earth, the distance spanned north/south by a degree of latitude is constant, while the distances spanned east/west by a degree of longitude is greatest at the equator and shrinks to zero at the poles. So line drawn on the map that isn’t exactly east/west or north/south doesn’t represent the bearing angle from one point to another correctly, but will be skewed southward somewhat. For the purposes you want to use this for, though, it’s not that big of a deal.
Another thing to remember is that on a flat representation of a curved surface, like a map of the earth, a straight line is usually not the shortest distance between two points. For that, you’d want a “Great Circle” route plotter, and there’s a pretty good one with a Google Maps interface at the Great Circle Mileage Calculator and Display website. Unlike the RoutePlanner website, you have to manually choose the two points you want to draw a Great Circle between, but creating the points is easy:
1. Enter the locations that you want to create a Great Circle between in the box at the top.
2. Click on Start Course
3. Click on the first point marker, then the second, then click “End At Last Point”; the Great Circle Route will be drawn between the two. You can also add markers to the map manually at this stage as well.
The other options are fairly easy to figure out.
Following up on the previous post, an email pointed me towards Map Of The World – Shaded Relief, another Google Maps terrain-shaded relief site. It has some pros and cons compared to the GeoLabels website, but the two are a good complement to each other.
Pros:
- Larger Google Map size
- Ability to turn off man-made features (Relief vs. Relief+)
- VE button that overlays Virtual Earth maps (road map only
- “Search for place or feature” returns all features containing the search term, not just man-made, and plots them as markers on the map
- Far superior bathymetric (underwater) shading
Cons:
- Terrain shading not as colorful or visually appealing as GeoLabels website
- Maximum zoom level lower