blankblank blank


Archive for the 'Google Earth' Category Page 9 of 25


Plot Google Analytics Geographic Data In Google Earth/Maps

Johann Blake writes about his new tool to plot geographic Google Analytics data in Google Earth or Google Maps. Just follow the instructions on the website to export the Analytics data in XML format to your computer, then upload the file to the site. You have the choice of creating either a straight KML file for Google Earth, or a direct plot of the data in Google Maps; the latter doesn’t seem to work currently in Firefox 3, but does work in Internet Explorer. You get placemarks for every country from which you had a visitor, color/type coded by the total number of visitors:
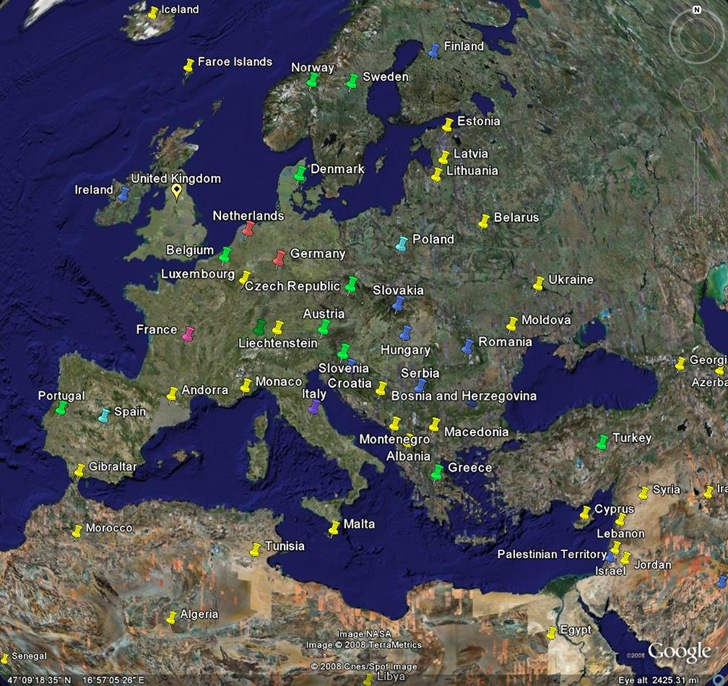
gega

Click on a placemark in either Google Earth or Google Maps to see the number of visitors from that country. You can use the standard Google Analytics controls to select the desired time frame, and also filter data.

It appears as though you can also select geographic sub-regions in Google Analytics like the US states below. I did get a bunch of error messages in Google Maps, and the District Of Columbia plotted in the South Atlantic, before the rest of the states plotted correctly:
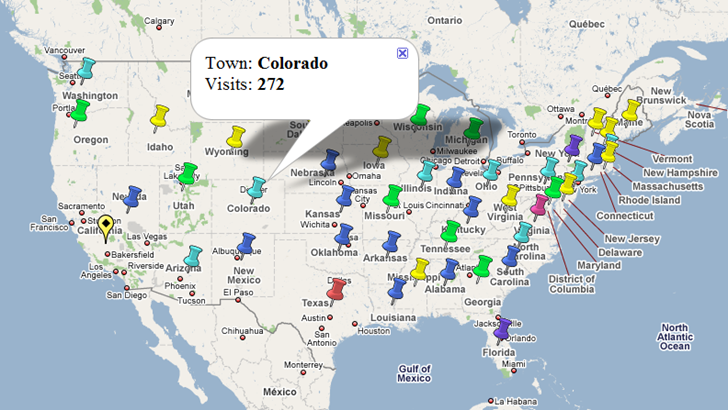
7-20-2008-8.55.39 PM

This older tool was able to plot individual visitors, but required a raw data export capability that Google Analytics no longer provides. So for now, Johann’s site is the best available GE/GM Analytics tool.
US Nautical Chart Overlay For Google Earth

Navimatics has created a KML network link that overlays marine charts derived from NOAA data onto Google Earth. Coverage includes all of the US coastline for the contiguous 48 states, but not Alaska and Hawaii yet. From high altitudes, coverage areas are outline with yellow lines:

Continue reading ‘US Nautical Chart Overlay For Google Earth’


Modify A KML Polygon File With Excel Data

Remy Paternoster writes to announce a new tool he’s created, an Excel app called KMLxl that imports a KML polygon/placemark file created in Google Earth, and lets you both attach data to each polygon and scale the height of the polygon to a variable value:

kmlxl

The process is straightforward, involving creating polygons and associated placemarks in Google Earth, importing the KML file into Excel with the app, adding data, and then exporting the results as a new KML file. You can update the Excel spreadsheet at any time with new data, and create a new KML that reflects the newer data. In addition to the app, Remy has an easy-to-follow step-by-step tutorial of the process in an accompanying PDF file.


KML Text Labels For Google Earth

While labeling items in Google Earth, you’re able to modify the font color, size and opacity. But one curious omission is the inability to change the font; you’re stuck with the Google Earth standard:

6-8-2008-4.29.11 PM

The font also stays the same size regardless of how far away you are from the labeled area, which can be useful sometimes. But if you have a lot of labels, this can result in lots of labels overlapping, and cluttering up the image. Label text is also all on one line, which can lead to long labels if you want to include lots of text.

Continue reading ‘KML Text Labels For Google Earth’


An Online KML Validator

A previous post linked to a video on how to add in-line KML validation to the Java-based text editor jEdit. There’s now another KML validation option for those who use their own editor to create KML files. Galdos Systems has created a free online KML validator; just submit a link to an online KML or KMZ file or upload the file from your computer (note: for online files, upper/lowercase matters!). You’ll get back a report page with:

  • The number of errors found, recommendations and suggestions
  • The specific errors found, referenced by line number in the original file
  • A listing of the original KML/KMZ file with line numbers, so you can cross-reference the error specified with the line number

An error doesn’t necessarily mean a fatal error; my test file had three errors, mainly related to spec changes in KML, but works fine in Google Earth. Still, even with a working file, it’s useful to see where it doesn’t conform to specs, and for a non-working file it can help you track down the error.

Via the Google Earth Blog.


Overlay Google Maps, Windows Live, Yahoo, Ask.com and OpenStreetMap Imagery In Google Earth

The Map overlays for Google Earth site (link fixed – sorry about that) lets you select a source of imagery (Google, Yahoo, Ask.com, Windows Live, OpenStreetMap), and create a KML file that overlays that imagery onto the terrain in Google Earth, with definable transparency. Note: leave the lat/long offset values at 0; these values let you offset the imagery to correct for minor errors in position, not set the initial view position. You can also download a KML file with links to all the imagery, and select the source by checking the appropriate box in the Google Earth pane. Here’s Google Maps’ terrain view in Google Earth:

Continue reading ‘Overlay Google Maps, Windows Live, Yahoo, Ask.com and OpenStreetMap Imagery In Google Earth’


Direction To A Geostationary Broadcast Satellite In Google Maps/Earth

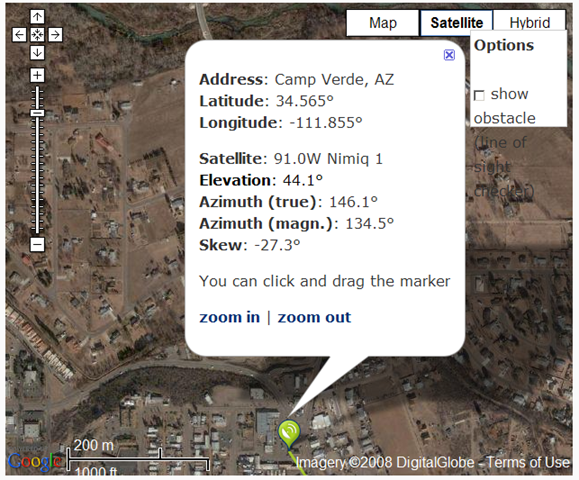
Here’s a slick little online geographic tool called DishPointer. Enter your position (latitude/longitude), or your address, then select from a list of broadcast satellites in geosynchronous orbit. DishPointer will bring up a Google Maps display showing the proper orientation for your dish antenna for optimal reception from the selected satellite:

Capture3-26-2007-2.31.46 PM5-19-2008-8.55.35 PM

Check the box marked “Show obstacle”, and you can move the marker to show the maximum height an obstacle (like a tree or a neighbor’s house) can have without blocking your satellite dish’s line-of-sight view.

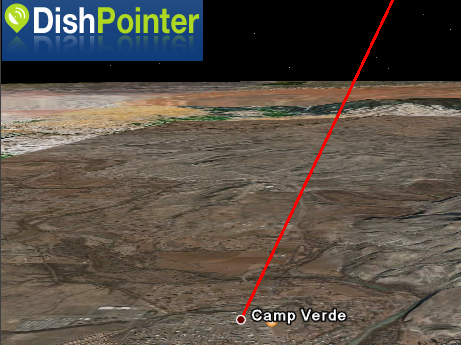
Click on the Google Earth icon, and have the line-of-sight to the satellite shown in 3 dimensions:

Capture3-26-2007-2.31.46 PM5-19-2008-8.58.21 PM

If your view of the satellite is blocked by terrain, that will be visible in Google Earth; if there are 3D buildings for your area, you’ll also be able to see whether your view is blocked by adjacent buildings as well.

Via OgleEarth.


Thematic Mapping In Google Earth

On his excellent Thematic Mapping blog (now part of my blog roll), Bjorn Sandvik has been running a series on thematic mapping techniques in Google Earth. Examples have included choropleth maps, bar charts, prism charts, Collada objects, map legends, including examples of animated time series. If you’re into the techy part of this stuff, the series is well worth a look for the ideas you’ll get from it, and the downloadable example files. But for non-techy types, the prospect of learning how to do this might have been a bit intimidating. Heck, I find it intimidating, and I know at least a litlle about this stuff.

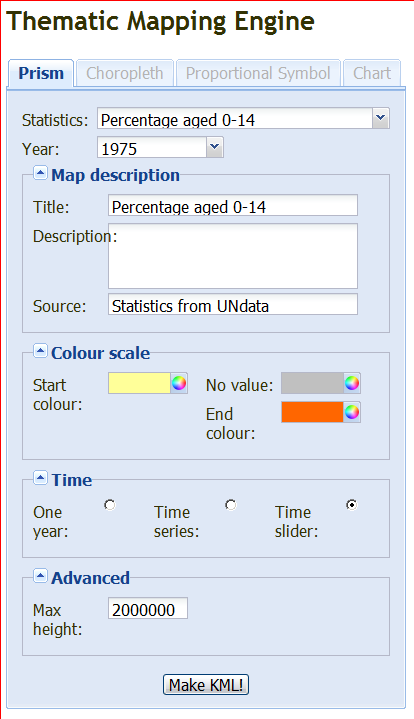
But Bjorn has taken his examples to the next level, by creating an online tool that can convert datasets to thematic Google Earth maps on the fly, the Thematic Mapping Engine:

Thematic Mapping Engine

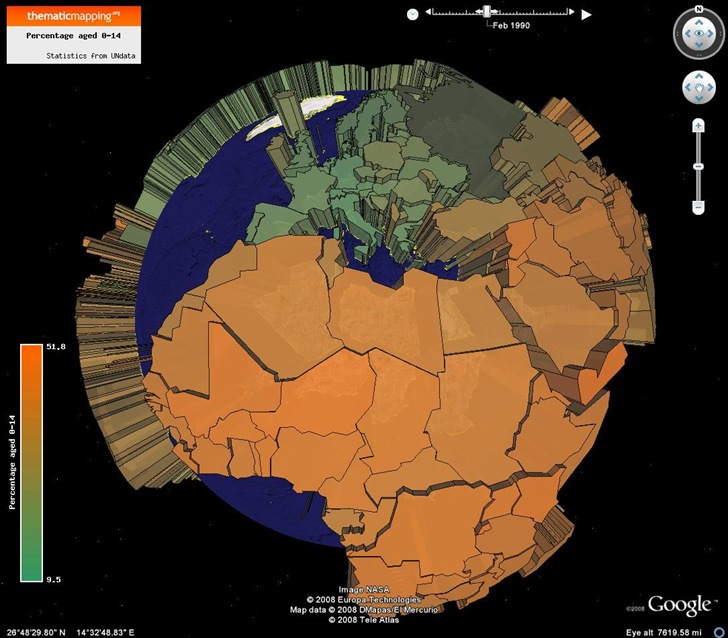
Only Prism maps are supported in this initial release, with other types (Choropleth, Proportional Symbol and Chart) coming in the future. You’re also currently limited in the datasets to 15 worldwide datasets from the UN, but the ability to import your own data is also coming. You can select data for one year, for a time series, or create a time map with a slider that lets you view the chart in animated format as the years roll by. The “colour” scale sets the endpoint colors for the chart, and these colors will be used to generate a legend for the chart. Click on Make KML, and you can download the KMZ file to your computer / open it in Google Earth directly:

globe

In Google Earth, use the slider at the upper right to change the data year, or click on the play button to see it animated.

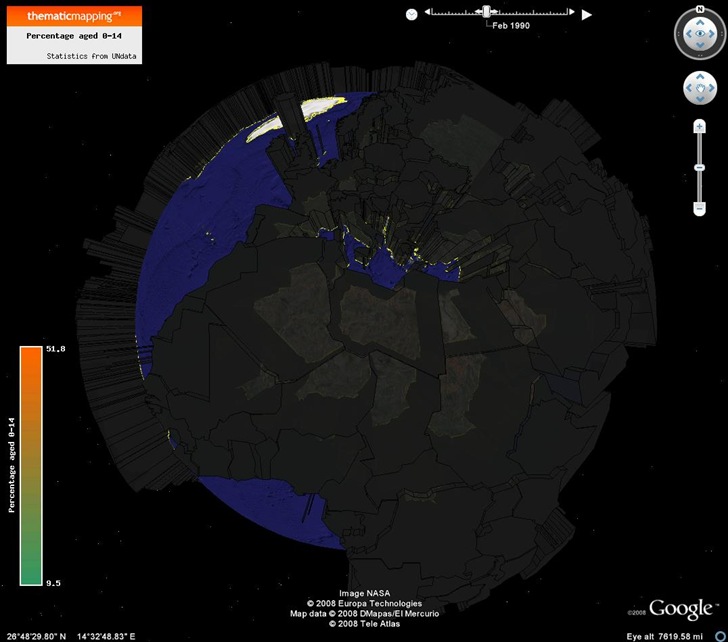
I did find one minor quirk, but it’s likely a Google Earth bug. On my system, the first time I load one of these Thematic Mapping Engine KMZ files into Google Earth, I often see something like this:

dark

By turning the “sun” on (the View => Sun menu), and then turning the sun back off again, I get the correct view (i.e. the first picture). Resizing the Google Earth view can also create this effect, but the solution is the same.