OgleEarth posts on SOLA G2, a free program (PC/Mac; free for non-commercial uses) for converting 3D objections in a number of standard formats into Google Earth KML files:
- Autodesk *.FBX (2006.11)
- 3D Studio *.3DS
- Wavefront *.OBJ
- Autodesk *.DXF
- Collada *.DAE
- Should also work with objects created with the free open source 3D program Blender, as long as you export them in a compatible format.
Select a filetype, choose the location, units and orientation, and SOLA G2 supposedly does the rest. I say supposedly only because I don’t have any files to test it out with; feel free to post your results in the comments below. You can also download the legacy version 1.0 of SOLA in case you have problems getting good results with version 2.0.
The best way to display shapefile data in Google Earth is to convert it directly into vector KML format, and I’ve covered several ways to do that for free or cheaply, including stand-alone programs and online converters. Of all these options, I prefer using either shp2kml or Shape2Earth because of the flexibility they offer in setting display attributes like color and shape. But there’s another option: convert shapefile data into a raster image, and then display it in Google Earth as a ground overlay. This has a few advantages over vector KML format:
Continue reading ‘Using Google Earth Ground Overlays To Display Shapefile Data’
In a previous post, I used MicroDEM’s ability to create GIF Google Earth overlays with transparency to create selective overlays of MicroDEM terrain analysis products. But you can use this ability with any georeferenced raster image, including topo maps, as long as the areas of the graphic you want to have transparent are white. One example would be USGS 24K topo maps, but these often have large areas that aren’t white, as in this case:
Continue reading ‘Creating "Transparent" Topo Map Overlays For Google Earth’
In a previous post, I talked about using MicroDEM to easily create Google Earth ground overlays, images draped over Google Earth terrain in the correct position, like this terrain-shaded topo map (viewed in Google Earth):
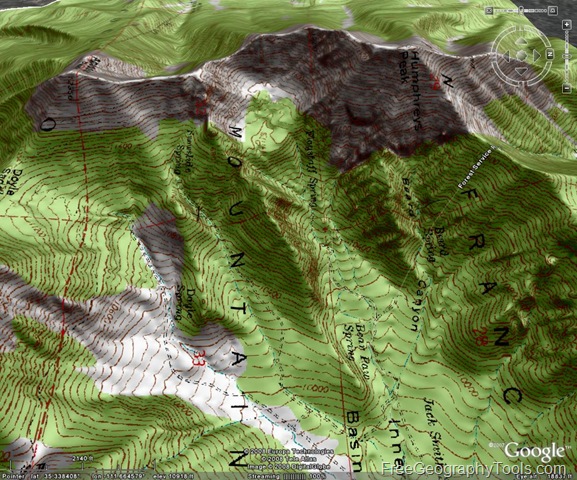
But you can also create a Google Earth ground overlay in MicroDEM as a GIF with transparency, where any part of the image that’s white will be invisible in the Google Earth overlay. There are a number of MicroDEM analysis functions that can produce a graphic product with the data product in color and the background in white. One example would be the terrain category function, where you can select parts of terrain based on parameters like slope, elevation, aspect ratio, and relief. Suppose I have a DEM displayed in reflectance mode:
Continue reading ‘Google Earth Ground Overlays With GIF Transparency’
In Google Earth, a ground overlay is an image that’s been imported into the program and “draped” over terrain as a substitute for the default imagery. In the Free and Plus versions of Google Earth, you have to position the overlay manually to put it in the right geographical context, stretching and rotating it until it’s properly positioned. Google Earth Pro is able to open some kinds of georeferenced images (like GeoTiffs), and automatically drape them in the correct geographic position, but at $400 it’s not for everyone. The free GIS program MicroDEM has recently added the ability to automatically create a Google Earth overlay from any georeferenced image it can open, including GeoTiffs, and formats like JPEG and BMP if they have worldfiles associated with them
Continue reading ‘Creating Google Earth Ground Overlays From Georeferenced Images’
Bill Clark, the author of the useful Google Earth Public Land Survey System (PLSS) tool, has a new online app for converting spreadsheet data into point KML files, and opening them directly in Google Earth. Spreadsheet files can be in XLS (Office 2003 or earlier for now, Office 2007 support coming), CSV, or TXT (tab-delimited format); the minimum data required includes only latitude and longitude (either decimal or degree-minute-second formats are acceptable). Optional additional data accepted includes:
- Name for each point
- Description (text for pop-up balloon)
- Icon (use the table on the web app page to select a number corresponding to the desired icon graphic)
- Formatting tags (size and color of icon, altitude, connecting lines)
Make sure the column headings are included, exactly as specified on the web page’s instructions; there’s an option on the web page to review the spreadsheet data online to make sure it’s correct. The data is formatted into KML at the server, then sent back to your computer to be opened in Google Earth; the original data is then deleted at the server end for security. If you want to save the data displayed in Google Earth, make sure you right-click on the data item in the Places window on the left, and save it in either KML or KMZ format.
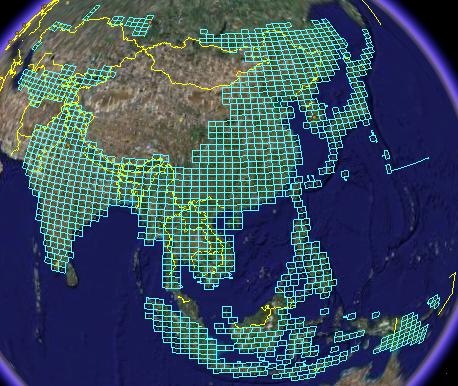
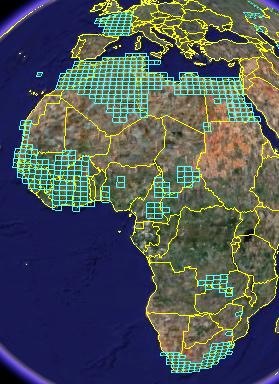
An earlier post featured a Google Earth KML file by Price Collins that indexed US Army topographic maps (1:250K) downloadable from the Perry-Castaneda Map library. At that time, 435 city maps and 413 1:250K quadrangles had been indexed, with each indexed map reference in the KML file containing a download link to the original map graphic file. Price writes to say that he has finished the index; it now includes 1785 topo quadrangles, covering large parts of Asia, Oceania, and Africa:
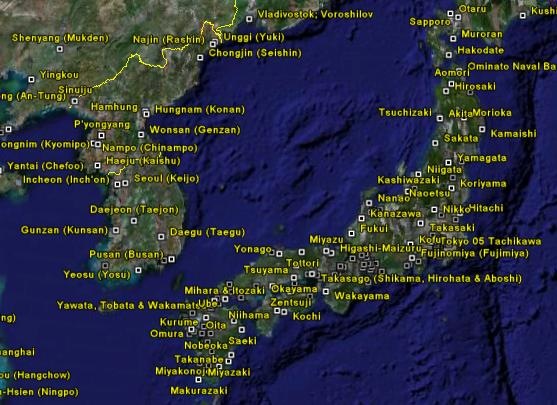
Also, 440 city maps; this picture shows those available for part of East Asia
OgleEarth posts about a new KML layer for Google Earth, available from NASA’s OnEarth website, that displays the most recent day’s MODIS (Moderate Resolution Imaging Spectroradiometer) imagery as a Google Earth overlay. Separate overlays from both the Terra and Aqua satellites include:
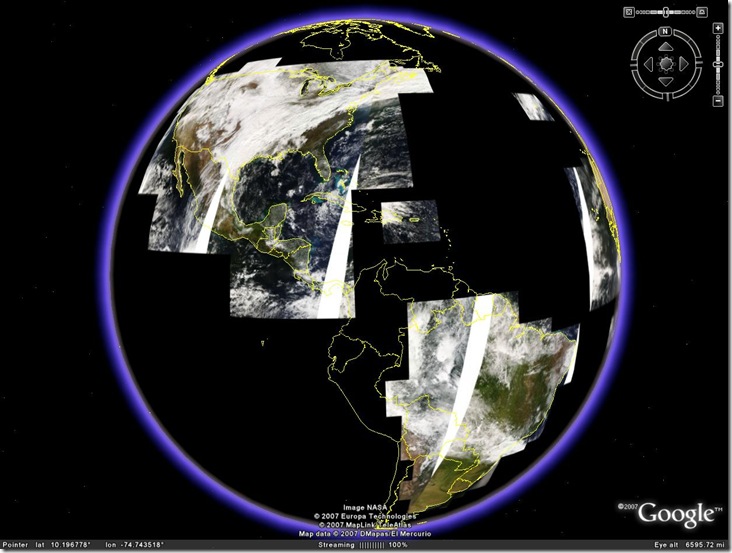
- Pseudo-color (Blue, green and infrared bands)
- NDVI (Normalized Differential Vegetation Index), where the greenest area have the highest vegetation level
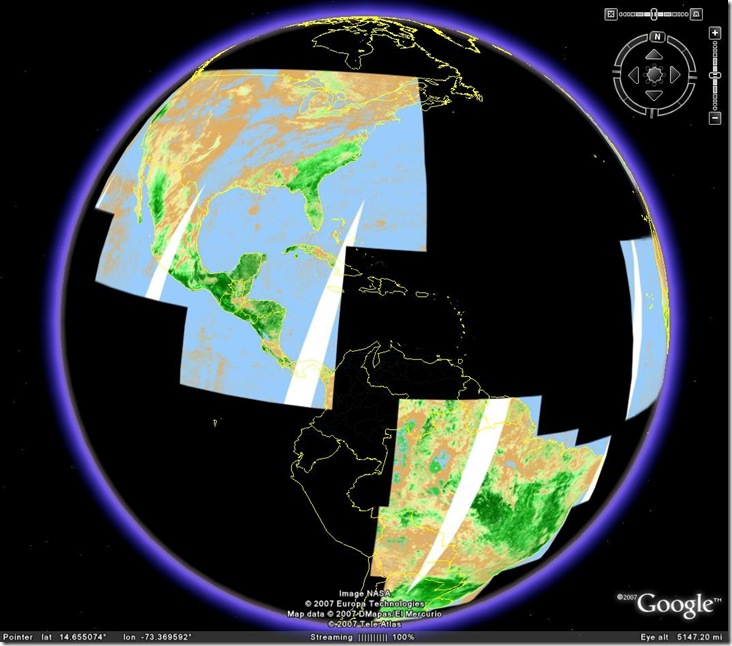
Even with two satellites, Terra and Aqua, MODIS images don’t cover the entire planet over the course of a single day. But over several days you’re likely to see the most up-to-date publicly-available satellite imagery of the surface of our planet. MODIS’s resolution is 250 meters, so don’t except to see whether your car is parked in your driveway on a particular day :).
Other sources of MODIS imagery:

