blankblank blank


Archive for the 'GIS' Category Page 5 of 23


Current National Weather Service Radar Data In Google Earth And GIS Formats

I’ve been using the website of my local National Doppler Radar Station for years now to monitor the animated radar precipitation loop, but I just noticed that there are a pair of links labeled KML and GIS Users. The KML link takes you to a page where you can select and generate a KML/KMZ link to live radar data from any single radar station, or from custom combinations of multiple radar stations. You can select from the data type you want:

  • Short-Range Reflectivity
  • Long-Range Reflectivity
  • Composite Reflectivity
  • Velocity
  • Storm Relative Motion
  • 1 Hour Precipitation
  • Storm Total Precipitation

and choose either animated loops or static images to display in Google Earth:
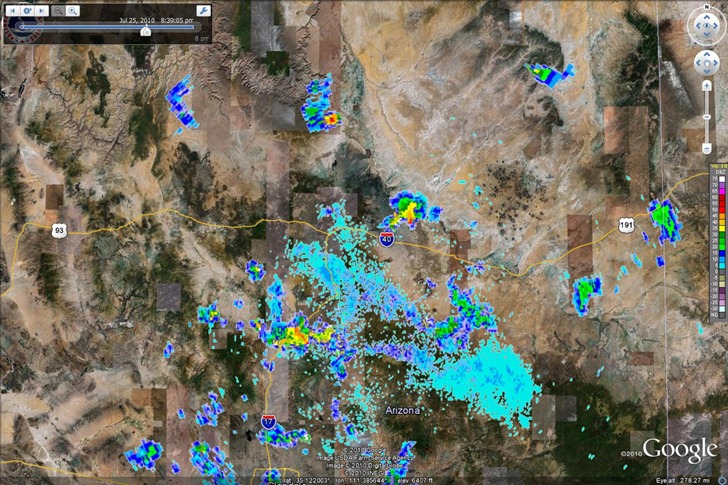
radar

For animated loops, I’d recommend setting the animation speed slider in the middle of the range or higher, and checking the Loop Animation box:
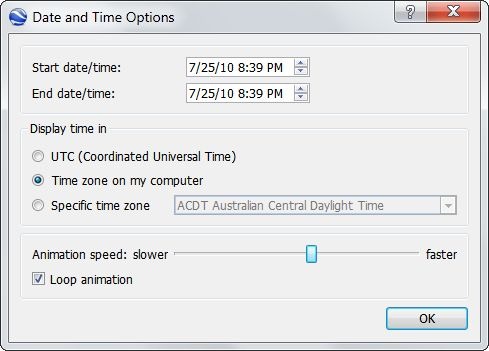
slidercontrol

And it usually takes several loops before all the image overlays fully load in for display.

The generated KMZ files are network links, updated every two minutes so that they’re always current. So if you download a KMZ link from this site, open it in Google Earth, then save it in My Places, you’ll always have it available for up-to-date radar views.

The GIS Users link takes you to a general info page, and then to a directory page where you can download static GIF images with current radar data. You’ll need to know the three-letter code designation for your desired radar station, but there doesn’t seem to be an easy way to look that up; go to the main page, click on the desired radar station, then hunt around on the page to find the 3-letter code. The GIF images have corresponding .gfw worldfiles for georeferencing (latitude/longitude, NAD83), so you can load them into your GIS viewer. The GIF background color is transparent, so if your GIS viewer supports it, you can display the data as an overlay on top of another map, like this one of one-hour-total precipitation on top of a topo map:
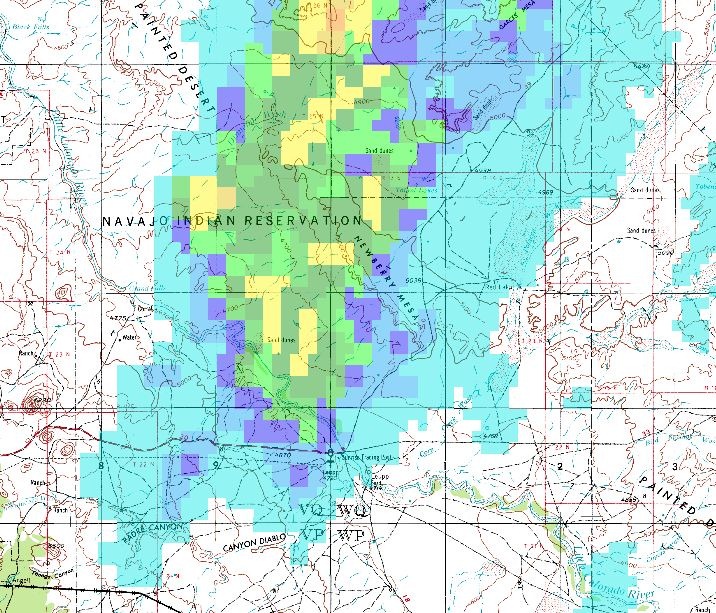
onehourprecip


US Wildfire Data

As you may have heard, there are three wildfires burning close to Flagstaff, Arizona where I live, the largest being a monster blaze on the east side of the San Francisco Peaks. Data on the extent and coverage area of the fire has been hard to find in local media, so I did a hunt on the Internet for the data. A lot harder to find than I thought it would be, especially in GIS-friendly format. Here are some of the resources I found:

Active Fire Mapping Program: A US Forest Service site.  Lots of promising links, but none of them were fully up-to-date, the WMS links were all dead, and the “Interactive Fire Detection Viewer” was inoperative (thanks, ArcIMS!).

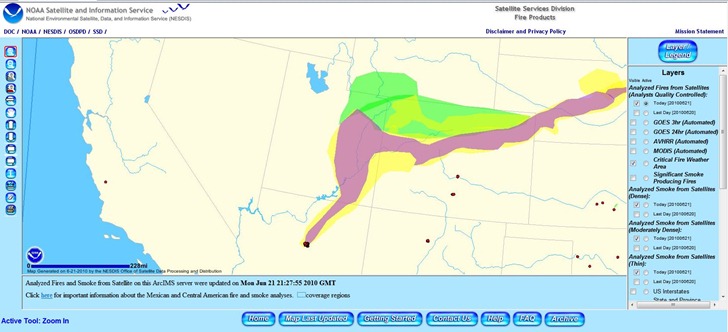
SSD Fire Detection Program Viewer: From NOAA’s Satellite Services Division. Somewhat more useful than the previous link; has a working map viewer with multiple data layers, including smoke plumes and up-to-date fire locations.

ssdviewer

But there doesn’t seem be an easy way to export the data in GIS-friendly format. There’s a download button, but it only gives the options of graphic and text data export, and the text data is in a very-unfriendly non-standard format.

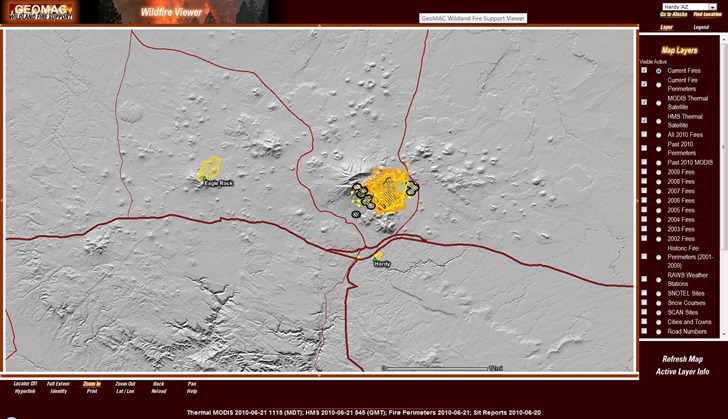
GeoMAC Wildfire Information: Geospatial Mult-Agency Coordination Wildland Fire Support site, put together by the Departments of Interior and Agriculture. By far the best site I found for current wildfire info. Note: You may need to enable pop-ups for this site.

First off, it has a working map viewer with understandable/relevant data layers. Here’s the current map viewer, with a more classic map-layer approach:

geomacviewer

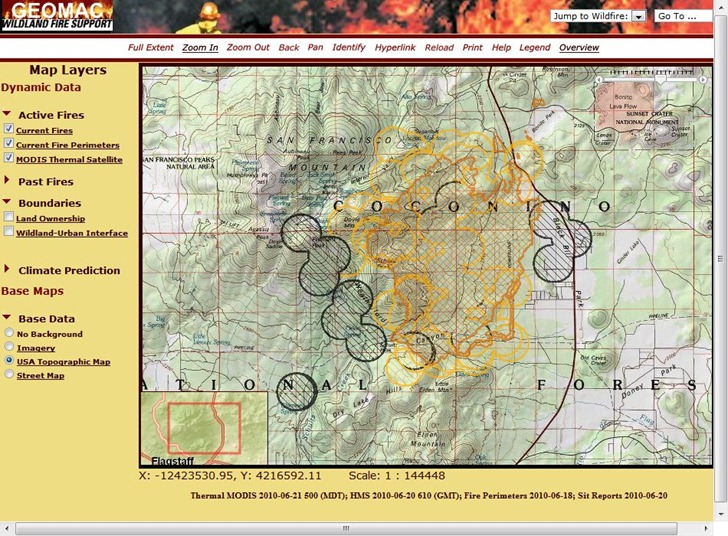
The beta viewer offers more background map layers, including satellite imagery, street maps and topo maps:

geomacviewerbeta

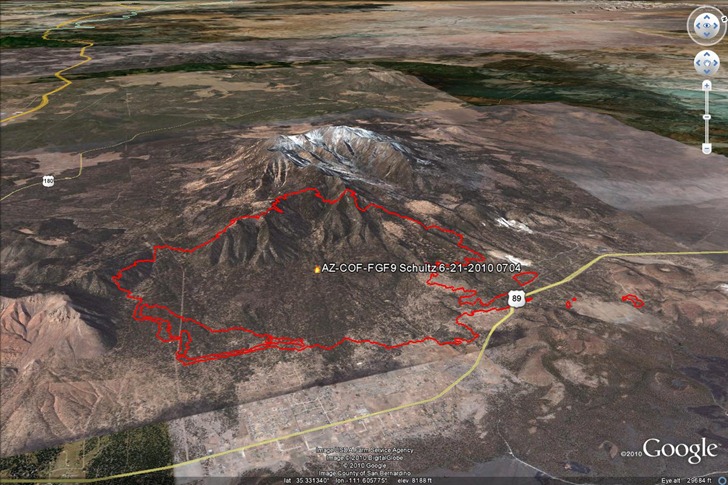
There are also links to GIS-friendly shapefiles, Google Earth KML files with current fire perimeter boundaries:

schultz621

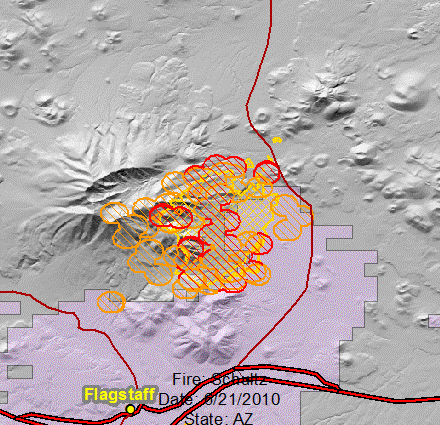
And a Quick View Active Perimeters buttons for a fast fire map, with legend:

Schultz-6_21_2010 (1) legend

HT to Dan Garcia for the GeoMAC site.


World Vector Data (VMAP0 and VMAP1) In Shapefile Format

About three years ago, I posted about Penn State’s Digital Chart Of The World Server, which hosted old 1991/1992 VMAP0 world vector data from the National Geospatial Agency in E00 format. More recent data is available directly from the NGA, some of it in the higher-resolution VMAP1 dataset not available from Penn State, but the NGA data is in the uncommon VPF format that many GIS programs can’t handle. The Russian GIS Lab website has converted more recent VMAP0 and VMAP1 data into the more-commonly-used shapefile format, and made it openly available for download. You can get VMAP0 data for the whole world at this link, and the higher-resolution VMAP1 data for selected areas at this link.

While you can get similar and much fresher shapefile data for some of this info from the CloudMade OSM shapefile data site, and from the Natural Earth vector dataset, the VMAP0/VMAP1 files include data like railroads, utilities, cultural landmarks and others that can be difficult to track down.


ArcGIS.Com Goes Into Beta

Lots of post on numerous blogs in the past few days about ESRI’s ArcGIS.com site coming online in beta format. From the help file:

  • Tools for building interactive maps
  • Maps and applications from the Web and GIS communities
  • Basemaps and specialty layers from ESRI
  • Developer resources for building Web mapping applications
  • Storage space for your map and application resources
  • Communities for sharing geographic information
  • Easy-to-use search for quickly finding what you want
  • Ranking and rating system for shared maps and applications

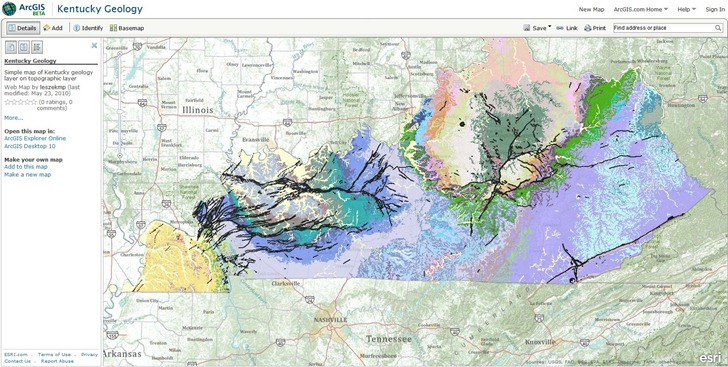
Requires an ESRI Global Account to save maps and upload data (free); even if you have a GA, you may have to register for a new one, as it wouldn’t take my old account info. Creating a basic map is pretty simple – choose a background map and a data layer:

kygeology

In my ignorance, I was hoping for a full free online GIS experience, like the GISCloud app I posted about a few weeks ago, and this isn’t it. For online data sources, you’re limited to either ArcGIS Server, Web mapping services, or mobile apps. For your own data, you’re limited to data packages created by ArcGIS products, like map packages (mpk) or layer packages (lpk). If you don’t have ArcGIS, you’re out of luck – no raw data files like shapefiles or raster imagery accepted as content. That isn’t a slam – it just means that I’m not the intended target, an ESRI product owner who wants to develop web/mobile mapping sites and applications. If you are, this site is very definitely worth exploring. Of note for app developers, there are APIs for Javascript, Flex, Silverlight, iPhone and Windows Mobile. For more info, I’d recommend a listen to the latest Very Spatial podcast; they have an interview with Bern Szukalski of ESRI about ArcGIS.com.

Addendum: James Fee has a far more comprehensive (and knowledgeable) overview than mine.


GISCloud – An Online Geographic Information System Application

I’ve been playing around a bit with GISCloud, a web-based GIS program. Looks interesting, and promising, but still has serious limitations. Feature set includes:

  • Raster and vector data display
  • Vector layer import and editing, including shapefiles, MapInfo, KML, tab-delimited and GPX
  • Built-in datafile coordinate reprojection; recognizes prj files, and lets you select the output coordinate system (including the one for your current project)
  • Advanced GIS analysis tools, including buffering, spatial selection by analysis, layer comparison (e.g. intersection), and area calculations.
  • Export vector data layers in shapefile, MapInfo, CSV or KML; this makes it a handy online format converter.
  • Share map editing with other users (or just publish it for viewing)
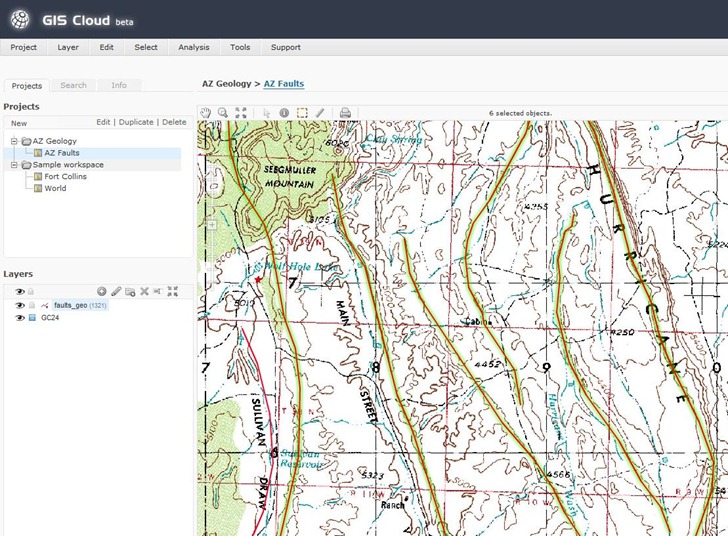
  • Easy-to-decode classic-looking GIS interface:

GISCloud

On the downside:

  • Only data layers imported into or through a PostGIS connection can be used for analysis and editing. I’m not up on PostGIS so I couldn’t test these functions, and none of the data sample sets have PostGIS data, either. You can apparently upload data and import it into a PostGIS database, though.
  • Uploading files can take a while (though they’re saved locally); GISCloud recognizes files in compressed archives, so you’re best off zipping up your data before you upload it.
  • For PostGIS data, I suspect that upload times are going to limit the size of the vector/database layers you can use.
  • Apparently no thematic (attribute-based) display colors yet; this is a major drawback.
  • Raster imagery updates during zooms can be slow.
  • Not all raster image types supported (e.g. 8-bit indexed GeoTiffs don’t work, 24-bit do).
  • It’s not exactly the zippiest GIS platform I’ve ever worked with.
  • It’s Flash-based, so Flash haters and iPad users should avoid, and everyone should expect CPU/performance/crashing issues. Flash 10.1 is supposed to be out soon, and supposedly will address some of those problems.

An interesting early effort in cloud-based GIS, and I’ll be watching its development. But unless you have access to, and/or experience with, PostGIS, of limited utility for now. And I don’t expect to see cloud-based GIS replacing dedicated GIS programs any time in the near future – too slow, and too limited.


OA Digital Version Of gvSIG 1.9 Is Out

Back in November, I posted about the release of the gvSIG 1.9, a free multi-platform Java-based GIS program. Oxford Archaeology Digital, which created their own improved installer for the previous 1.1 version of gvSIG, has just released the second beta of a similar improved installer for version 1.9. Differences from the official baseline 1.9 installer include (from the website):

  • Completely new installer frontend.
  • Bundled with many extensions.
  • Java Runtime Environment version 1.6r17 (Linux and Windows versions only).
  • Complete and consistent English (GB, US) GUI translation.
  • Heavily reworked and improved menu structure, keyboard shortcuts and layer context menus.
  • Additional documentation and sample data.
  • Better integration into all supported operating systems.
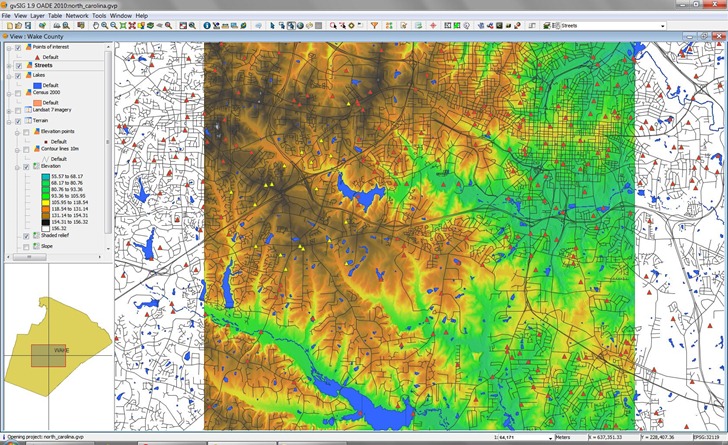
  • Both Windows and Linux versions are now available; a Mac version is listed as coming soon (the earlier version is still available with a Mac installer). I had no problems installing it on Windows 7, but some people apparently have; the website includes a workaround fix if you run into those issues. Screenshot showing sample data:

    gvsig1.9

    Having played around with it a bit, I have a few initial impressions.

    The feature set is one of the strongest of any free GIS program currently available, especially if you choose to install all the optional plug-ins (highly recommended, as is the sample dataset option). Many of these come from the Sextante plug-in, which adds a staggering amount of functionality for vector manipulation/analysis, network/topology, geostatistics, aerial/satellite imagery processing, rasterization, vectorization, georeferencing, hydrology, pattern analysis, etc. – well over 200 new functions. Combine that with the standard gvSIG feature set plus the new version 1.9 features, and few free GIS programs compare. You’d pay thousands of dollars to get much of this functionality in commercial GIS software; for free, downloading and installing this is a no-brainer.

    But there are some issues with it. Frankly, it’s a bit slower than other GIS programs in loading, displaying and redrawing data, and this is with my reasonably fast system. Somewhat more annoying is that it isn’t always fully responsive. For example, clicking on layers to select them can take repeated attempts to be successful. Some of the new functionality doesn’t seem to be working yet; for example, several attempts to generate vegetation indices (e.g. NDVI) from the sample dataset using the Sextante functions were unsuccessful – I got a blank image. The same functionality in SAGA (from which many of the Sextante functions were derived) worked fine. Documentation for the Sextante functions isn’t adequate to figure out what I might be doing wrong; for that matter, documentation for the extensive set of new functions in the gvSIG base program are currently only available in Spanish (there’s an English PDF manual for the previous version included in this distribution). So expect to spend some time figuring out how do do things.

    These are minor quibbles, though, and I expect that all these teething issues will be fixed before long. In particular, I look forward to English documentation of the new features. Even in its current form, I think I’ll be using gvSIG a lot, and I look forward to seeing how it develops in the future. Many thanks to both the gvSIG developers and OA Digital.


    Converting DEM Files To .asc Format For Terrain Bender; Creating Matching Raster Overlays

    In an earlier post, I covered Terrain Bender, a program that lets you create varying-angle terrain views from digital elevation models (DEMs), with optional overlay imagery, analogous to the view you get from the window of an airplane:

    Continue reading ‘Converting DEM Files To .asc Format For Terrain Bender; Creating Matching Raster Overlays’


    Intro To GIS/Mapping For Non-Profits (And Everybody Else)

    SlashGeo posts about the Illustrated Guide To Non-Profit GIS And Online Mapping from MapTogether, a website from the Community Cartography Project. It’s a really good, basic introduction to the concepts behind GIS and digital mapping, and examples of their use. The whole site is worth poking around if you’re interested in the topic, especially the blog posts. If you’re interested in moving forward from this guide, you can try MapAction’s Field Guide To Humanitarian Mapping, and also the great tutorial series from the Department of Land Affairs, Eastern Cape, South Africa called introducing GIS.