There’s a new service from the USGS that lets you download 1:24K, 1:100K and 1:250K topo maps for anywhere in the US in GeoPDF format. It has an easy-to-use interface based on Google Maps that makes finding your location, and downloading the desired maps in compressed zip format, straightforward.
Continue reading ‘Downloading USGS Topo Maps In GeoPDF Format, And The GeoPDF Plug-In’
Honest-to-God (almost) real-time satellite data from the EarthNow! viewer. The catches are that it’s low-resolution (250-meter) Landsat data streamed from the satellite to your computer screen, so you only see the area the satellite was above recently. And since the image data is constantly scrolling across the screen, the only way to save an image is to do a screen capture. Still, fun to watch (click on the image below for a larger view, showing part of Michigan):
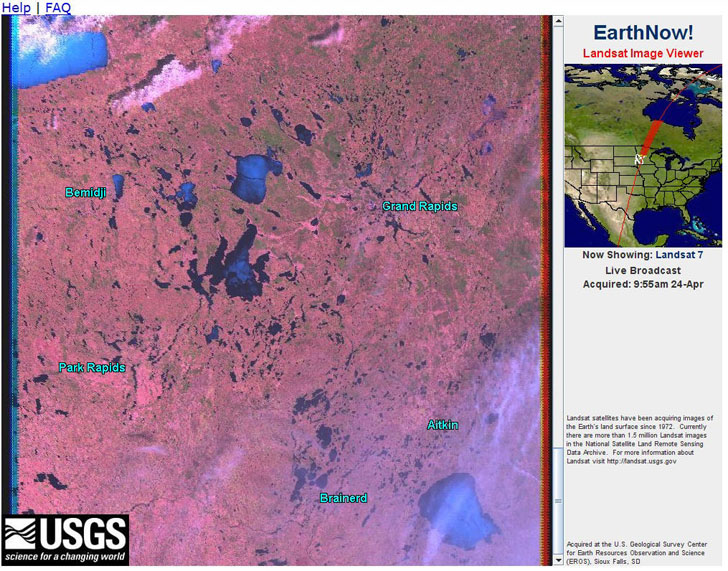
Via AllPointsBlog.
Edited 4/25 to change the resolution from 30 meters (which is what processed Landsat band data is) to the correct number of 250 meters. Also, it’s not really “real-time”, but almost.
Other mapping sites seem to be doing an Earth Day related post, so I’ll move this one up a bit. Energy production from the heat of the earth (geothermal energy) generates no carbon dioxide emissions that contribute to global warming, and could produce as much as 100,000 megawatts in the US alone by the year 2050. Here are some websites with geographic geothermal data, both maps and downloadable data.
Continue reading ‘Geothermal Resources Data’
A handy source of world vector data, the National Geospatial Agency’s VMAP0 vector data from 1992/1993 has been converted to E00 format and issued as the Digital Chart Of The World. While more recent VMAP0 data is available from the NGA (and even higher-resolution VMAP1 for some areas of the world), it tends to be in the VPF format, which many GIS programs don’t read. While it may be a bit older, DCW data is readily available in E00 format, which many GIS programs can read directly, and it can be converted to shapefile format for compatibility with virtually every GIS viewer and editor.
Penn State maintains the Digital Chart Of The World Server, which offers up DCW data in E00 format by country (and in some cases, e.g. Brazil, Canada, and Australia, by state). Data available includes:
- Political/Ocean (Point)
- Populated Places (Polygon)
- Populated Places (Point)
- Rail Roads (Line)
- Roads (Line)
- Utilities (Line)
- Drainage (Network)
- Drainage (Point)
- Drainage Supplemental (Point)
- Hypsography (Network)
- Hypsography (Point)
- Hypsography Supplemental (Line)
- Hypsography Supplemental (Point)
- Land Cover (Polygon)
- Land Cover (Point)
- Ocean Features (Line)
- Ocean Features (Point)
- Aeronautical (Point)
- Cultural Landmarks (Point)
- Cultural Landmarks (Line)
- Transportation Structure (Line)
You can download the digital vector data directly, or view a GIF preview of the data individually or collectively. Most data is in geographic format (latitude/longitude), with the notable exception of Russia in Lambert Conformal Conic. While the documentation states in one place that the spheroid is the Clarke 1866, it appears from other references that the data is actually in WGS84 datum.
Once upon a time, LizardTech, the owners of the Multiresolution Seamless Image Database (MRSID) compressed image technology often used with satellite and aerial imagery, had a free stand-alone viewer available on their website. Using this viewer, you could open full MRSID images, and export re-sampled subsets as TIFF images, GeoTiffs if the MRSID file was georeferenced or came with a world file. But LizardTech dropped the link for that stand-alone viewer download from their website some years ago, and now they only offer a browser plug-in that only allows viewing of MRSID images, and command-line utilities that convert the entire MRSID file into what could be an enormous TIFF image file.
But the Internet being what it is, it’s difficult to eliminate a file completely, and there are a couple of locations that still have the stand-alone MRSID viewer available for download. The Library Of Congress has many downloadable maps in MRSID format, and they offer a download link to both the viewer install program and the PDF manual (there’s also a viewer and manual available for Macintosh OS 9.x). The Spatial Analysis Laboratory of the University Of Arkansas at Monticello also has the install program, along with a downloadable PDF lesson on how to subset a georeference MRSID file and export it as a GeoTiff.
You can also use the free TatukGIS Viewer (Windows only) to open, view, and export MRSID files as well.
18,000 years ago, at the height of the last ice age, much of the Northern and Southern Hemispheres were covered by ice, and the climate and ecosystems were dramatically different. The Review And Atlas Of Palaeovegetation has links to maps and web pages describing the changing climate from 18,000 years and more ago.
Continue reading ‘Ice Age Palaeovegetation Maps’
Via OgleEarth, a relatively new blog called Census KML Data Visualization has been posting visualizations of US Census data in Google Earth, with links to the KML files. Newer posts have branched out to visualizing campaign contributions by congressional district and time. Nice stuff, and a good complement to the gCensus site.
The United Nations Food And Agriculture Organization (FAO), AgroMet division, has compiled a database of climatic information gathered between 1961 and 1990 from close to 30,000 observation stations. This database, and applications designed to extract, analyze and map the data, are available online.
Continue reading ‘FAO World Climate Data’

