

Swivel is a site where anyone can upload data of any kind in tabular or spreadsheet form for general public access, and plot it in a variety of graph formats. Today at Where 2.0, they will announce the new capability of plotting geographic data in Google Maps. See the Webware article for more information and a screenshot. Another more flexible option for this kind of display is Google Map Creator, which creates thematic shapefile maps in Google Maps, but Swivel seems like it may be easier to use.
Archive for the 'data' Category Page 15 of 19
The National Solar Radiation Database offers solar radiation data and limited meteorological data for 237 sites in the US over the period 1961-1990, and expanded data for 1454 sites from 1991-2005:
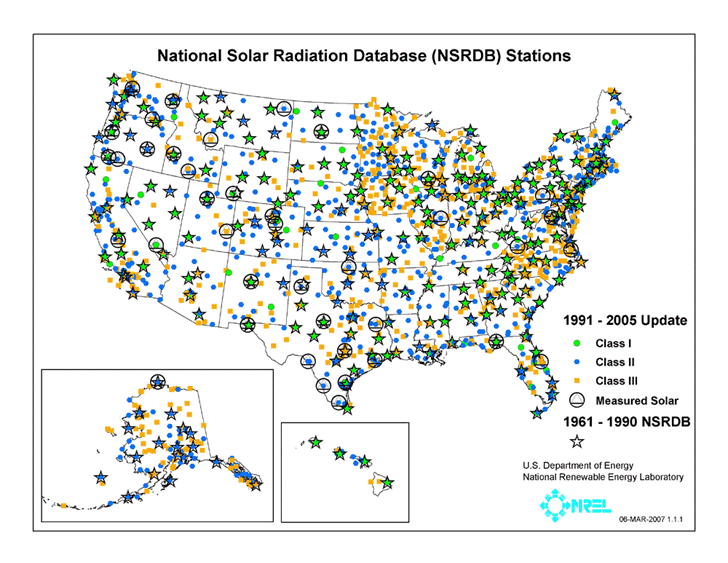
Data includes:
- Daily Statistics Files
- Hourly Statistics
- Threshold Files
User manuals in PDF format can be downloaded. Data is in text format, but can be converted to spreadsheet format with a bit of work.
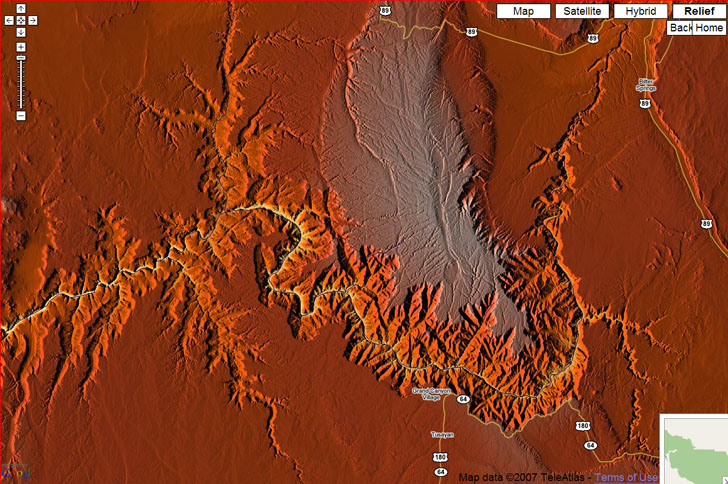
Hans writes to say that they’ve updated their World: Relief Map And Geolocations website, covered in an earlier post. There’s a new button labeled “Maximize”; click on it and the Google Maps view expands to fill your entire screen. Click on it before zooming in; if you click after you zoom, it will zoom you way out again. You can now get some spectacular wide-area colored terrain relief images that you can save with a screen capture program:
From the abstract at the Geographically based Economic data (G-Econ) website:
“The G-Econ data set calculates gross value added at a 1-degree longitude by 1-degree latitude resolution at a global scale for all terrestrial cells. These data allow better integration of economic and environmental data to investigate environmental economics, the impact of global warming, and the role of geophysical factors in economic activity. On of the major results is to show that the true economic deserts of the globe are in Greenland, Antarctica, northern Canada, Alaska, and Siberia.”
Downloadable spreadsheet data includes not just economic data, but also environmental data:
- Precipitation (monthly)
- Temperature (monthly)
– Terrain
- Elevation
- Roughness
- Standard deviation of elevation
– Vegetation
– Soil Types
Convert the spreadsheet data to shapefile format, or plot it directly in Google Earth using GE-Graph.
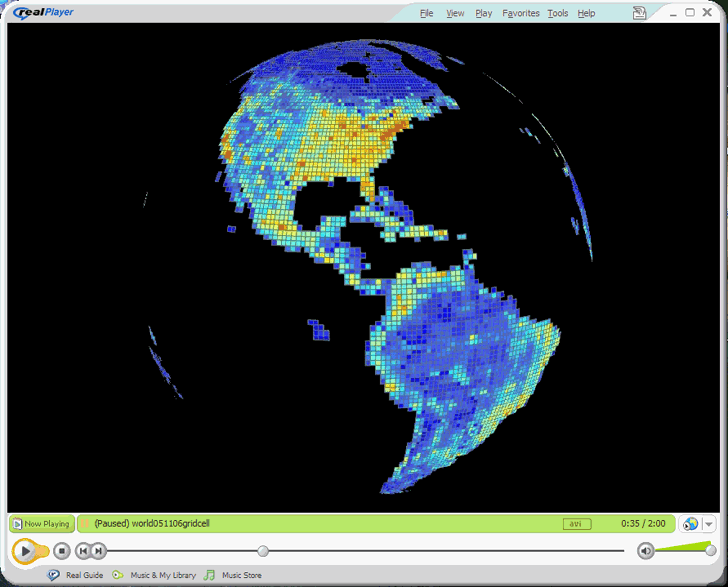
The site also has rotating globe animations with data plotted:
A recent post covered a website with Public Land Survey System (PLSS) shapefiles, and a geocoder that gives the PLSS data for an entered set of coordinates. In the comments, Bill Clark points out his Township And Range website, which links the PLSS data to Google Earth.
You can:
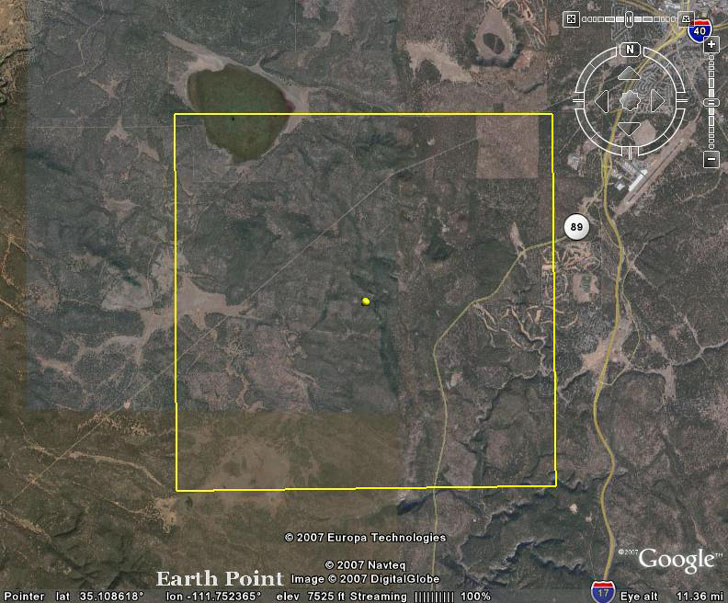
– Enter a State, Principal Meridian, Township and Range, and be flown to that square in Google Earth:
– View National Atlas PLSS data directly on Google Earth (full coverage of the central and western US, but no mile sections, and less accurate than BLM data):
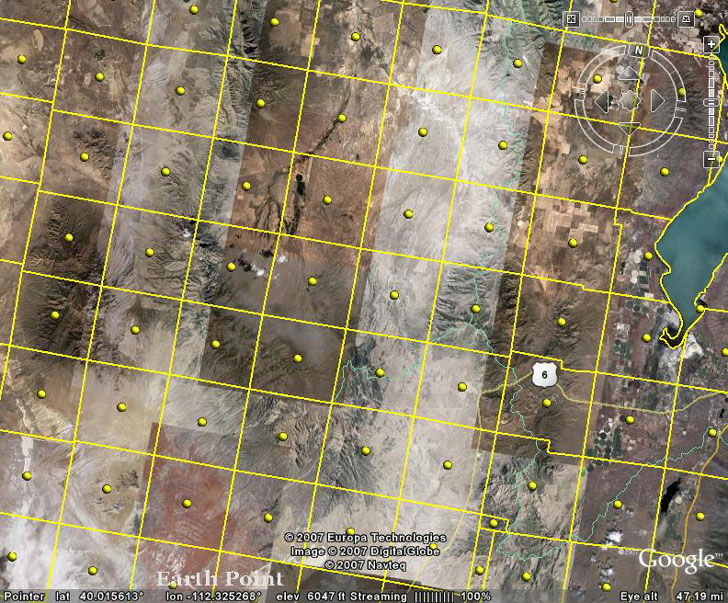
– View BLM PLSS data directly on Google Earth (less coverage than the National Atlas, but more accurate, and shows mile sections):
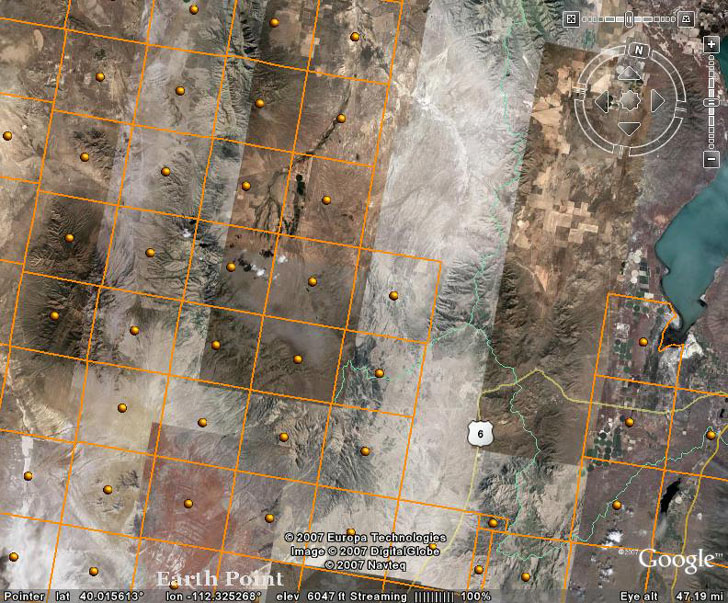
You have to zoom in to the point that less than 200 townships are visible; the closer you zoom, the smaller the section that become visible. And be patient, it can take several minutes for the data to load in completely. Click on the ball in the center to see the PLSS info for the squares.
Nice job, Bill!
NASA’s Goddard Space Flight Center in Maryland maintains the Global Change Master Directory, one of the largest (if not *the* largest) collections of links to data I’ve found on the Internet, somewhere on the order of 15,000. While the header refers to “Earth science data and services”, it’s not limiting itself to the traditional definition of “Earth science” there (i.e. fields like geology, geophysics, meteorology, etc.).
The data is initially divided into 14 broad groupings:
- Agriculture
- Atmosphere
- Biosphere
- Biological Classification
- Climate Indicators
- Cryosphere
- Human Dimensions
- Land Surface
- Oceans
- Paleoclimate
- Solid Earth
- Spectral/Engineering
- Sun-Earth Interactions
- Terrestrial Hydrosphere
Going to these pages, you’ll find the topics broken down further into subtopics, and even sub-sub-topics. For example, under Climate Indicators, you’ll find sub-topics for:
- Air Temperature Indices
- Drought/Precipitation Indices
- Humidity Indices
- Hydrologic/Ocean Indices
- Ocean/SST Indices
- Teleconnections
You can also search for data by map, date or location name. This is a “must-bookmark” data resource.
NOAA’s Meteorological Development Laboratory offers degrib, a multi-platform application that downloads many different kinds of US Weather Service forecast data (e.g. temperature, precipitation, wind, etc.) from the National Digital Forecast Database. Data is available for every 3 hours for the next 72 hours, every 6 hours for the next 7 days. Degrib also converts the data into GIS formats: shapefile, CSV, NetCDF and binary float (.flt) format. Data is also available via WFS, XML, and in a graphic web browser format.
Via The Earth Is Square, which has screenshots and more
If you need to identify a township or section on map, or plot Public Land Survey Systems (PLSS) boundaries, you can get this data from the Land Survey Information System website, managed by the BLM. Shapefile data is available for most of the US, grouped by state and/or county, in the NAD83 datum. File data includes township, section, subsection, latitude/longitude, and metadata. Note: Make sure you have pop-ups enabled.
There’s also a Township Geocoder web form. Enter the latitude and longitude of the point you’re interested in, NAD27 or NAD83, and get back the state, principal meridian, township, range, section, quarter section, and quarter-quarter section. Or enter the previous data, and get back a latitude/longitude. You can enter individual points, or upload a file for batch point conversion.