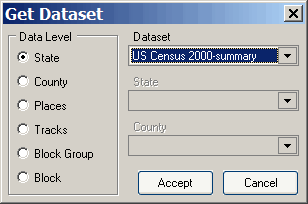
Bruce Ralston, author of the free TIGER to shapefile conversion utility tgr2shp, has a new program called tgr2kml that converts US Census TIGER file polygons (but not points or lines) into KML files. It works on TIGER files from 1994 to 2006 Second Edition (future TIGER data will be issued directly in shapefile and web formats).
First select the TIGER files you want to process (they can be in zipped format):
Continue reading ‘Convert TIGER Polygons To KML Files’
Enter a zip code, and ZIPSkinny gives you a summary of census data for that zipcode, including:
- Education
- Marital Status
- Economic Indicators
- Demographics
- A comparison with neighboring zipcodes
- The location of that zipcode in Google Maps
- The top 100 zip codes for selectable categories
- The ability to enter and compare data from up to 20 zip codes
Via Explananda.
Another slick brand-new tool from Zonums Software, the GE-Census Explorer lets you interactively display, plot and analyze US Census data in Google Earth.
The initial interface is deceptively simple:

Folder icon at left: “Get Dataset”. Lets you select the geographic extent of the dataset you want to look at:
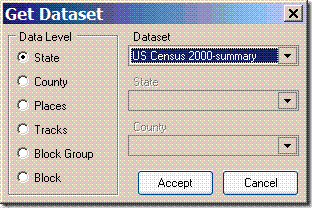
Continue reading ‘Interactive US Census Data Viewing In Google Earth With The GE-Census Explorer’
The state of Utah’s Automated Geographic Reference Center (AGRC) has spectacular high-resolution color aerial photography and digital elevation model (DEM) data available for the entire state, with limited areas having even higher spatial resolution.
- 5-meter DEM data derived from aerial orthophotos is available for the entire state in ASCII ArcGrid (*.asc) format. You can use the FTP site along with statewide index shapefile to determine which files to download, or use the Interactive Map site. You may have to right-click on the file and choose “Save Link (Target) As”, otherwise the ASCII Grid files may open up as text in your browser. MicroDEM can open ASCII ArcGrid files directly (if you get an error message, zip the DEM file, then open the zipped file). Here’s a reflectance image of a 5-meter DEM of the Zion National Park area:
Continue reading ‘High-Resolution Aerial Photography And DEM Data For Utah’
A cartogram is a map where the area depicted depends on the value of a variable instead of the actual geographic size within the boundaries of the area. Worldmapper has a large collection of cartograms (366, with more added all the time). Here’s a cartogram of number of plant species by country:
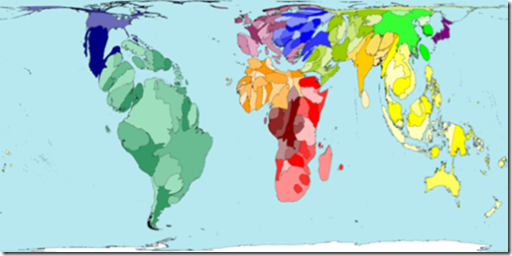
In addition to the graphic image, which can be downloaded by right-clicking on it and choosing “Save Image”, you can also download the data used to create the maps in Excel format and OpenDoc format. Some maps include animations of the map morphing from a standard map to a cartogram, and/or can be downloaded in PDF poster format (missing for some of the newer maps).
More info about cartograms is available at Cartogram Central.
Via BlinkGeo.
In addition to a subscription service with more data, features and capabilities, Social Explorer offers an easy-to-use demographic data mapping and download service, with US Census data from 1940-2000. Select from population, age,sex, marital status, race, education, housing, industry and many more. Each category has its own set of subcategories to choose from for mapping, e.g. for population you can plot population density, % urban, % rural, % inside urbanized areas and % inside urbanized clusters.
The Maps Social Explorer opens up a Flash (?) interface, with demographic parameters selectable using the drop-downs at the upper right. Mapping can be done by census tract (as above), or by 2000 Congressional District boundaries. You can zoom into any area of the US:
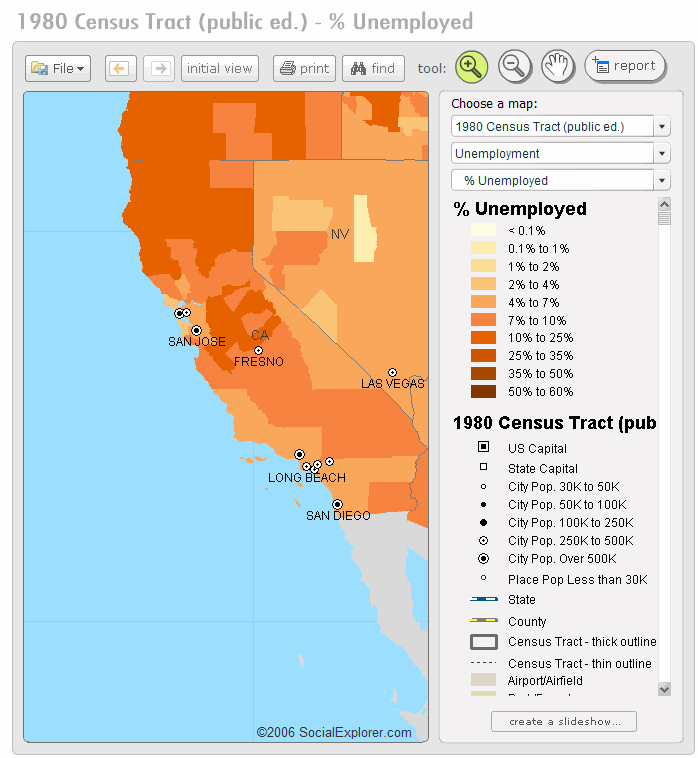
Select Print, and the map and legend will open up as images in a separate window, so that you can save or print them. Select Report, and you can view tabular data for a selectable area of the visible map, and download it in Excel format.
With the Reports Social Explorer, view similar demographic data for the entire US, state, county or census tract in tabular format on-screen, and download it in Excel format.
The European Petroleum Survey Group (EPSG; now defunct, and superseded by the OGP Surveying and Positioning Committee) created and maintains a spatial reference database, assigning EPSG code numbers to spatial reference systems (combinations of coordinate systems, projections, and datums). There really is no way to figure out the spatial reference system from just the code number alone, or vice versa, so you need to look them up. The official database is in Microsoft Access format, not terribly easy to use; the code list in tabular format isn’t much better. There’s now a convenient online version of the database, searchable by keywords or code number. You can then access additional information for that spatial reference system in a number of different formats:
- Human-Readable OGC WKT
- Proj4
- OGC WKT
- JSON
- GML
- ESRI WKT
- USGS
- MapServer Mapfile
- PostGIS spatial_ref_sys INSERT statement
Users can also upload their own spatial reference definitions, which I suppose is a good thing as long as you exercise caution in using them.
Via import cartography.
Tom Patterson is a cartographer with the US National Park Service, and runs the Shaded Relief website, with many articles, tutorials and links related to terrain shading techniques in cartography. But he has also created fantastic terrain and landcover imagery and data, all of which is freely downloadable, license-free and reproducible in any format. These would make great background imagery for national and world maps created using GIS software. Some of the files are very large (well over 100 MB in size), so downloading them may take a while depending on your connection speed.
Continue reading ‘US/Global Terrain Shading Data And Landcover Imagery’