blankblank blank


Archive for the 'data' Category Page 11 of 19


Urban & Environmental Modeler's Datakit

Via the Kelly Lab Blog, the Berkeley/Penn Urban & Environmental Modeler’s Datakit has an enormous set of vector and raster data for the contiguous 48 US states:

Vector:

• Municipal, county, metropolitan area, and state boundaries, as assembled from the US Census Bureau’s 1990 and 2000 TIGER data.
• 1990 and 2000 census block and census tract boundaries and selected attributes, including net housing and population densities.
• Highway, railroad, and urban rail transit networks; and air and seaport locations as assembled from the U.S. Department of Transportation’s Bureau of Transportation Statistics.
• Locations of major employment centers and employment data for 1994 and 2003.
• Boundaries of all federal lands, including national parks and monuments, national forests, Bureau of Land Management lands, and military facilities.
• Locations of all major water bodies including rivers, streams, lakes, and reservoirs.

Raster:

• Municipal, county, metropolitan area, and state boundaries.
• Census block and census tract boundaries and selected attributes, including net housing and population densities (blocks) and population, housing, and demographic data (tracts).
• Boundaries of all federal lands, including national parks and monuments, national forests, Bureau of Land Management lands, and military facilities.
• Elevation and slope data generated from the National Elevation Dataset (NED).
• Comprehensive land cover data for 1992 and 2001 from the U.S. Geological Survey, including agriculture, forest, pasture, urban, and wetland locations.
• Locations of all major water body polygons, including lakes and reservoirs.
• Locations of lacustrine, palustrine, and riverine wetlands from the National Wetlands Inventory.

Data is in Lambert Conformal Conic NAD83 projection.


Reproject NOAA BSB Raster Navigation Charts And Export Them In TIFF Format

Yesterday, I posted about a NOAA site where you can download Raster Navigation Charts (RNC), maps of coastal and inland waterways. The charts are currently only available in BSB format, which many GIS programs can’t handle; I linked to a few free viewers that will let you view the maps, but not export them. They’re also only available in the Mercator NAD83 projection/datum. Peter Guth (the author of the terrain analysis GIS MicroDEM) let me know about a free utility available from NOAA called the Digital NOAA Nautical Chart Reprojector. It lets you re-project the BSB maps into one of 32 projections (e.g. geographic or UTM) and over 100 datums, then exports the chart in BSB, RAW or TIFF format with a world file; the latter virtually every GIS program and graphics editor can open. It looks like it was originally a command-line utility, since a DOS box pops up when you run the program, but it now comes with a GUI:

NOAA Chart Reprojector

The Input File and Output File dialog windows are a bit clumsy to use until you figure them out, but for the input file, you’re looking for the .kap file that came with the zip file you downloaded from the NOAA mapsite. Choose the desired output parameters at right, including choice of output file format (TIFF here), projection (UTM) and datum (WGS_84). The GUI doesn’t set the UTM zone automatically, but you’ll see the West and East Bounds for the map in the Input Info window at left, and can use those as a guide for setting the correct UTM zone with the Projection Parameters dropdown at right. In this case, clicking “Run” will create the TIF file specified as the output file, along with its worldfile. The file extension for that worldfile will be .tifw; if your GIS program doesn’t accept that, try changing it to the more-commonly seen .tfw extension.

NOAA also has a free extension called Chart Viewer that lets you open BSB charts natively in ESRI’s ArcView and ArcGIS, and Leica Geosystems’ Imagine.


Downloadable Updated NOAA Raster Navigation Charts

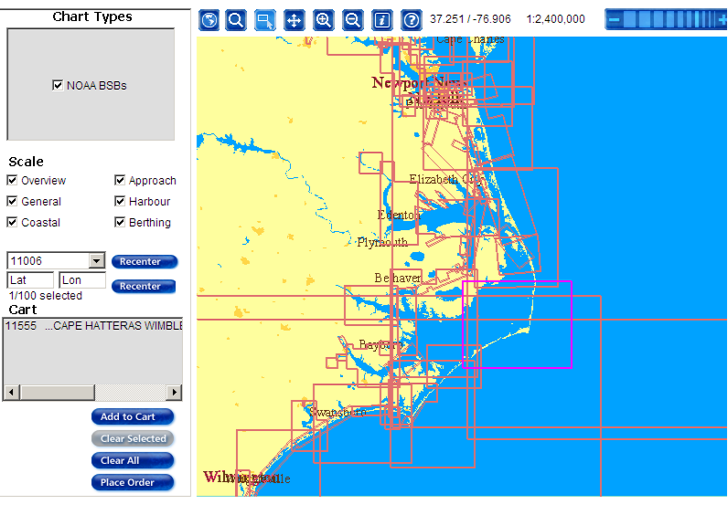
NOAA’s Office Of Coast Survey has downloadable copies of regularly-updated RNCs (Raster Navigation Charts). The updated charts are in BSB format, not supported by many GIS and graphic software programs, but there’s a list of links to free and demo software packages capable of displaying BSB files in georeferenced format (like Caris EasyView and GPSNavX). The site indicates that NOAA will issue GeoTiff versions of these charts at some unspecified point in the future, but those charts will not be as regularly updated as the BSB charts will. Selection is either by chart number or a graphical viewer (requires Java):

bsbgraphicalviewer

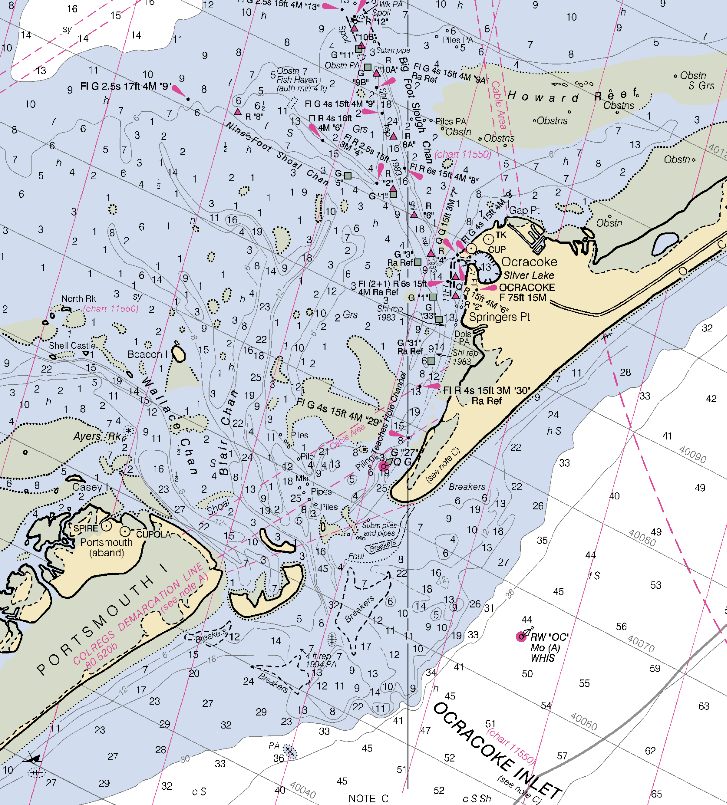
To choose a chart for downloading in the graphical viewer, click the “Selection Mode” button at the top, then click on the rectangle defining the chart area (clicking inside the rectangle does nothing). Click “Add To Cart” at left, which adds it to a list of charts to be downloaded. When you’re done selecting charts, click on “Place Order”, and follow the directions to get a zipped copy of the BSB chart (response time to the button-pushing may be slow):

bsbfull

Native map projection for the georeferencing is Mercator NAD83, in meters.


Downloadable US Bathymetric And Fishing Maps

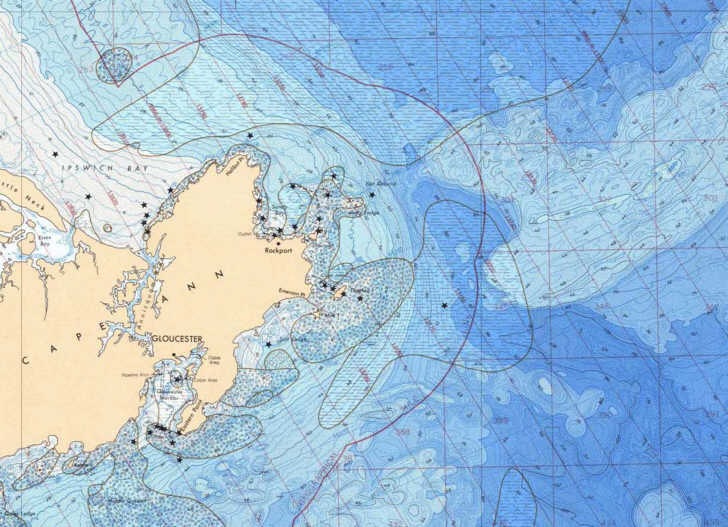
The National Geophysical Data Center has downloadable bathymetric and fishing maps for most of the US ocean coastline (not intended for navigation purposes, though). Map catalogs are broken down by geographic region, and maps are available in both small PDF preview format and large format downloads in either PDF or TIF format (the latter in gz compression, which will require an unzipping program like WinZip or ZipGenius). If you need the PDF maps in a editable graphic format, you can use a program like PDFCreator to “print” the PDF maps in full-resolution TIFF, JPG, or PNG formats. Maps are also not georeferenced (not GeoTiffs or GeoPDFs); I hope to cover some basic georeferencing options soon.

capeann

The full sets of data available from the NGDC include more bathymetric and relief data, geology/geophysical data, and earthquake/volcano data.


Free Neighborhood Boundary Shapefiles

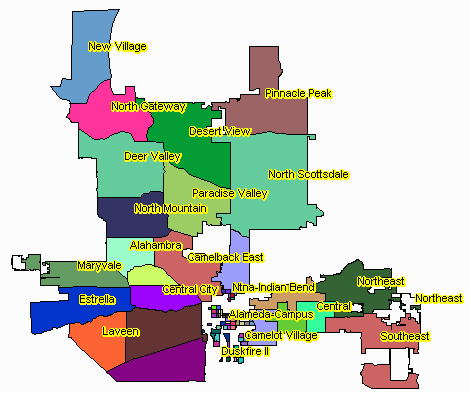
Zillow has released shapefile boundaries describing neighborhoods in 150 major cities, grouped by state. Available under the Creative Commons license, they’re free for general use in any application as long as you attribute Zillow as the source. Coverage is still limited; in Arizona, only the two largest urban areas (Phoenix and Tucson) are included. But Zillow encourages submissions of neighborhood boundaries for cities not currently covered in their database, and will work on including those submissions after they’re verified. Projection is geographic (latitude/longitude), NAD83.

phoenix neighborhoods

Phoenix neighborhoods (created with the TatukGIS Viewer)

Via the James Fee GIS Blog.


Most Recent MODIS Imagery In Google Earth

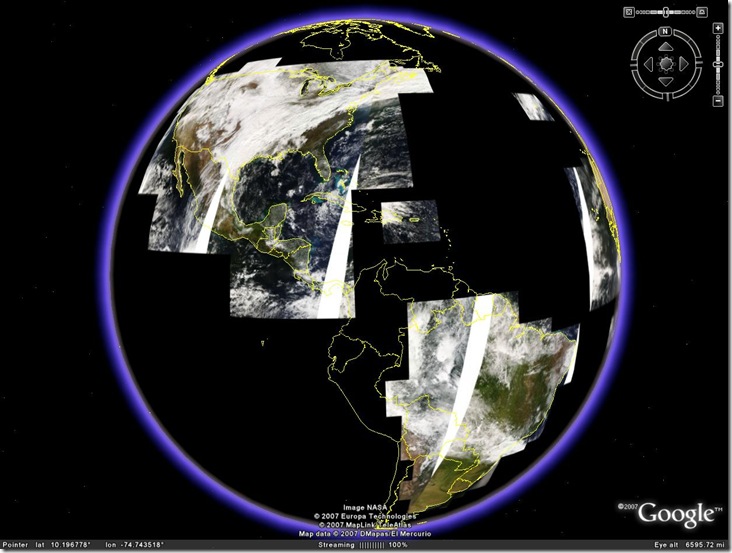
OgleEarth posts about a new KML layer for Google Earth, available from NASA’s OnEarth website, that displays the most recent day’s MODIS (Moderate Resolution Imaging Spectroradiometer) imagery as a Google Earth overlay. Separate overlays from both the Terra and Aqua satellites include:

  • Real-color imagery

modisrealtime

  • Pseudo-color (Blue, green and infrared bands)
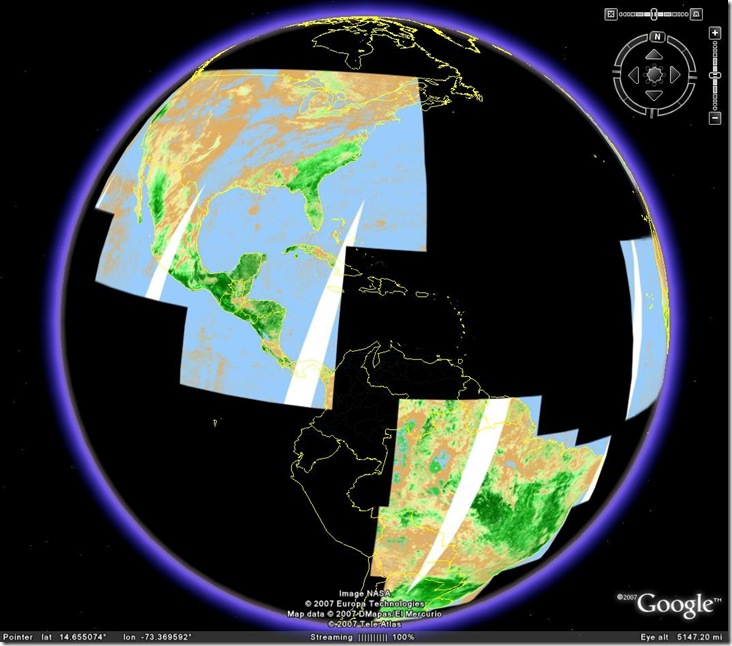
  • NDVI (Normalized Differential Vegetation Index), where the greenest area have the highest vegetation level

modisndvi

Even with two satellites, Terra and Aqua, MODIS images don’t cover the entire planet over the course of a single day. But over several days you’re likely to see the most up-to-date publicly-available satellite imagery of the surface of our planet. MODIS’s resolution is 250 meters, so don’t except to see whether your car is parked in your driveway on a particular day :).

Other sources of MODIS imagery:


Quick Data Gridding With QuikGrid

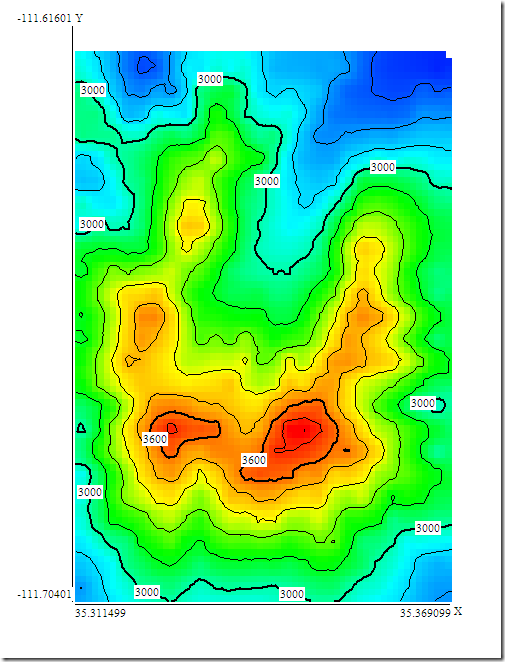
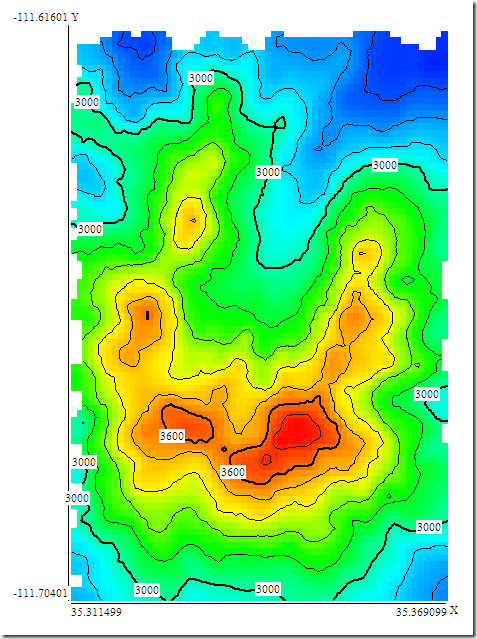
If you have a set of data points randomly distributed in space, and want to create a basic grid of evenly-spaced set of data points derived from this data (nothing fancy, like curve fitting or Kriging), QuikGrid is blazingly fast at this task. For example, here’s a evenly-spaced set of 625 elevation points (25 x 25) downloaded using the Zonums Terrain app, loaded into QuikGrid and displayed as a set of contours, and coloring representing different heights:

evengrid

For the same area, I also downloaded a set of 625 randomly-selected points, which QuikGrid can automatically grid, contour, and display in a similar fashion, essentially instantaneously:

randomgrid

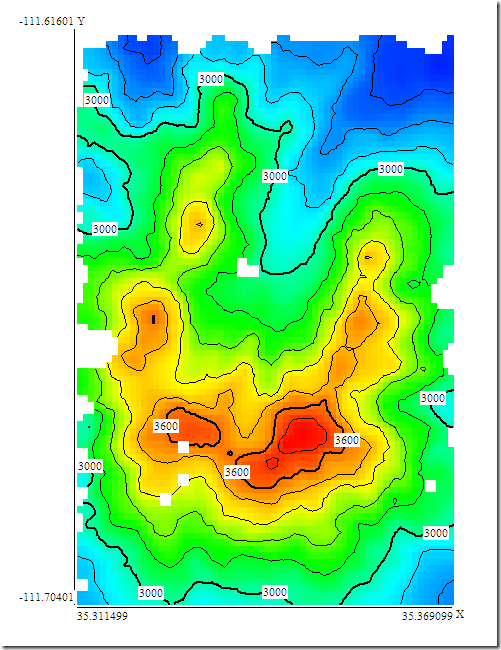
In some areas, the spacing between random points is too great for QuikGrid’s default distance cutoff tolerance, and it fills in those blanks with data values of zero. But by adjusting the tolerance, it’s possible to fill in some of those gaps:

randomgridplus

Some gaps on the edges, where it has trouble filling in the remaining gaps. Comparing this contour image to the evenly-gridded surface at the top, there are some differences, especially in locations where values changes rapidly. But for a basic approximation, it’s not bad, and offers a quick-and-dirty alternative to more complicated gridding processes.

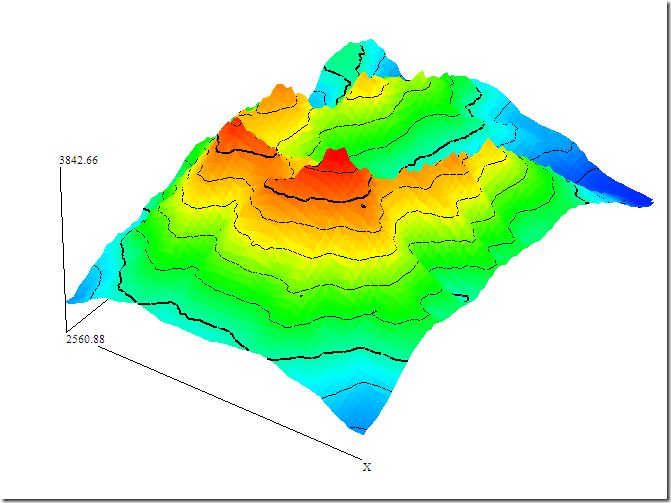
QuikGrid can also visualize grids in 3-dimensions as well:

3dgrid

Import formats supported by QuikGrid include data triplets with a variety of acceptable inputs for position, including variations on lat/long in degrees/minutes/seconds. If you have decimal lat/long, use the “Input metric data points” option, but be aware that the y-value will be longitude, and the x-value latitude, as in the examples above. It also accepts data point input in DXF and Submetrix format, as well as grid input in ER Mapper Raster, USGS 1-degree DEMs (aka 1:250K DEMs) and QuikGrid’s own grid format. Generated grids can be saved as xyz triplets, Surfer, QuikGrid and ER Mapper formats; you can also export contours and grids in DXF format, and grid surfaces in VRML. There are many other features, including a scripting language, and various display and labeling options.

The helpfile is comprehensive, and well-done, and includes instructions on running the program in Linux under the Wine emulator. The C++ source code is also available, released under the Gnu GPL.


Historical Census Data From the National Historical Geographic Information System

The National Historical Geographic Information System (NHGIS; free registration required for access) offers historical census data from the first census (1790) to the most recent. The types and extent of the data depend on the census year, with more data typically available from more recent census years. Data can be accessed for the entire country, by state, county, census tract, or other divisions where available, and can be downloaded in a number of different spreadsheet and GIS-compatible formats. The site also has shapefiles for the states/territories, counties, and census tracts appropriate for each census year. Online mapping of, and access to, some of the data from 1940 on is available for free at the Social Explorer website; Social Explorer offers full access to much more data and online maps as a paid service.