The Zonums Terrain web app lets you define a terrain area, either by coordinates or extent in a Google Maps interface, and then downloads elevation data for that area in tabular format. The points for which elevation is given can be either randomly distributed, or evenly spaced in a cartesian grid. Select the area using the web app form:
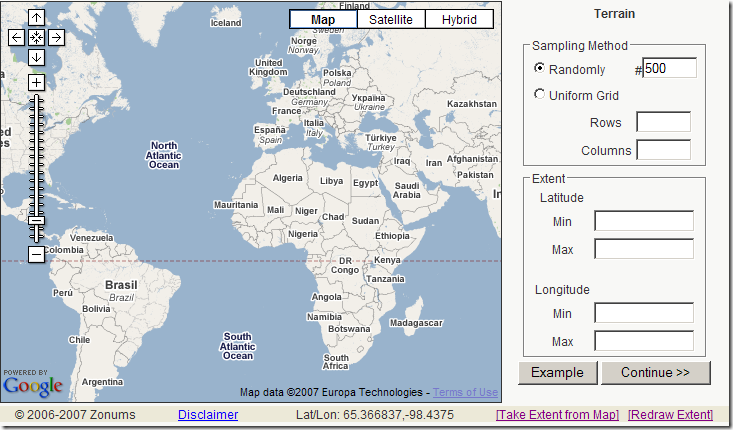
With a random distribution, you only have to enter the total number of points; for a grid, enter rows and columns and the program spaces the points evenly. You can enter the limits of the area numerically in the Extent boxes; the app will check to make sure that min is < max (remember that for western longitudes, further west is more negative, which is the lower value). You can also zoom into an area in the Google Maps interface, click on “Take Extent From Map”, and have the extent coordinates filled in automatically based on the displayed area. When you’re done, click on Continue, then click on the “Click here to Start” button that pops up on the Google Maps interface. The points will be generated and plotted one at a time in a Google Maps interface. This may take a while depending on how many points there are, roughly two points per second. Once all the points are plotted…
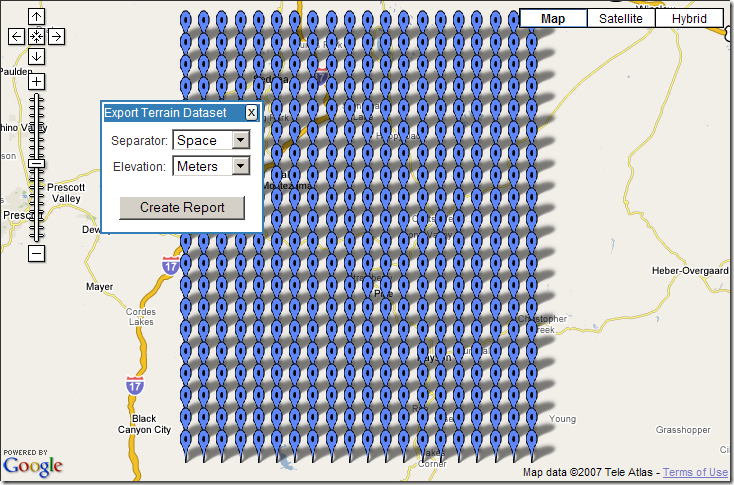
… select the separator/delimiter for the tabular data, and the units for elevation, and click “Create Report”. The app will open a new window with the latitude/longitude/elevation data in tabular format, which will have to be copied into another application like a text editor if you want to save it. From there, you can convert it to other formats; for example, if you use a comma as the separator, and save it as a CSV file, you can use a program like MapWindow to convert it to a point shapefile.
The true spatial resolution of the dataset you download will obviously depend on the number of points you select, the area chosen, and the fundamental spatial resolution of the data source. The app gets elevation data from the USGS seamless dataset, and automatically uses the best data available for a specific location. For most of the world, that will usually be the SRTM 90-meter data; for the US, that will usually be NED, with best resolution ranging from 30 meters to as good as 3 meters in some locations. Click on the About button at the top of the App, and then on the “Elevations source” link to get the following table showing the areal bounds for various levels of spatial resolution of the elevation data:
| Data Source | Extent (West,South, East, North) | SRTM Contiguous South America 90-meter (3 arc_second) elevation data | -93.0000000022799,-55.9999999977599 to -32.0000000047199,14.9999999993999 |
|---|---|
| SRTM Contiguous North America 90-meter (3 arc_second) elevation data | -180.000000005944,10.0000000008001 to 179.999999979387,60.9999999987549 |
| SRTM.C_1TO19_3 | -180.000000012589,42.0000000054 to 179.99999997275,60.00000000468 |
| SRTM.C_20TO43_3 | -179.000000007803,12.0000000044402 to 169.999999977999,42.0000000032401 |
| SRTM.C_SA_3 | -180.000000007038,-55.9999999942731 to 11.99999998515,30.00000000228 |
| SRTM.C_AUS_3 | -38.9999999991601,-55.9999999964333 to 179.999999992079,14.0000000007598 |
| SRTM Contiguous U. S. 30-meter (1 arc_second) elevation data | -180.0000000144,-15.0000000012 to -64.000000005144,61.00000000488 |
| Tampa Bay Topobathy Meters | -82.8750000000039,27.3749999992218 to -82.3750000000017,28.1249999992111 |
| Delaware Bay Topobathy Meters | -75.4966666666296,38.7527777768336 to -74.858611111023,39.4458333324399 |
| California Topobathy Meters | -124.979166666747,34.9169444435586 to -120.599722222299,38.9499999990807 |
| Puget Sound Topobathy Meters | -124.979166666747,34.9169444435586 to -120.599722222299,38.9499999990807 |
| Afghanistan Digital Elevation Model | -123.16037037040032,47.043796296291 to -122.1996296295827,48.168055555640194 |
| NED Alaska 2 arc second (15 minute) elevation data | -180.00333333334379,50.996666666667622 to -129.99666666663225,72.00333333335108 |
| NED Contiguous U. S. 1 arc second elevation data | -125,23.9999999973783 to -65.9983333286253,49.9999999992314 |
| NED Hawaii 1 arc-second elevation data | -161.0016666667,17.9983333327742 to -153.998333333366,23.0016666659869 |
| NED Puerto Rico 1 arc-second elevation data | -68.0016666666668,16.9983333328051 to -63.9983333330132,19.0016666662453 |
| NED US territories 1 arc-second elevation data (Islands with east longitude) | 133.9994444444,4.99944444427556 to 164.000555555645,16.0005555550985 |
| NED US territories 1 arc-second elevation data (Islands with west longitude) | -171.000555555605,-15.0005555550877 to -168.999444444485,-13.999444444001 |
| NED Contiguous U. S. 1/3E arc second elevation data | -99.00055555556,24.9994444436157 to -65.9994444443037,49.0005555546217 |
| NED Contiguous U. S. 1/3W arc second elevation data | -125.00055555557,25.9994444419356 to -98.9994444424024,49.000555554697 |
| NED Hawaii 1/3rd arc-second elevation data | -161.00055555563,17.9994444438804 to -153.999444444485,23.0005555548894 |
| NED US territories 1/3rd arc-second elevation data (Islands with east longitude) | 133.9994444444,4.99944444427556 to 164.000555555645,16.0005555550985 |
| NED US territories 1/3rd arc-second elevation data (Islands with west longitude) | -171.000555555605,-15.0005555550877 to -168.999444444485,-13.999444444001 |
| NED Mount Saint Helens 1/9th arc-second elevation data | -123.01299382719976,46.125000000000036 to -121.98700617287425,46.400000000001157 |
| NED Puget Sound 1/9th arc-second elevation data | -125.010000000012,46.4899999990561 to -121.489999999997,48.5099999990705 |
| NED Harris City 1/9th arc-second elevation data | -95.999999999999957,29.470000000000034 to -94.874999999995126,30.220000000003267 |
| NED Lincoln, NE 1/9th arc-second elevation data | -96.886929999156592,40.617497603779 to -96.4858805843566,41.007559363379 |
| NED West Virginia 1/9th arc-second elevation data | -83.000185185189991,36.999802029771907 to -79.999820566814307,38.500185185192592 |