

Monday’s post on the Thematic Mapping Engine reminded me that I’ve been meaning to post about Uuorld (pronounced “world”) for a while. Uuorld is also a thematic mapping tool, but uses its own custom 3D display engine instead of a standard digital globe or file format (like the TME’s use of KMZ for display in Google Earth or other compatible programs). It comes with roughly 120 or so datasets of demographic/commercial/land use data, which can be displayed for a preset world region, or for a custom region you can create yourself. Many of the datasets are time-based, allowing you to create animated prism or choropleth maps that can be exported in a number of video formats (mp4, mpg, avi and flv). Controls let you set the tilt and orientation of the 3D view, and export it as a TIFF, JPEG or PNG:
Archive for the 'data' Category Page 10 of 19
Continuing on from the first post in the series …
MetaCat: “Metacat is a flexible metadata database. It utilizes XML as a common syntax for representing the large number of metadata content standards that are relevant to ecology. Thus, Metacat is a generic XML database that allows storage, query, and retrieval of arbitrary XML documents without prior knowledge of the XML schema.”
ht to Matt Perry.
MetaLite: “MetaLite is a simple tool for collecting and validating Federal Geographic Data Committee (FGDC) compliant metadata. It allows a user to quickly document geospatial data while still adhering to FGDC Metadata Content Standards.” Features include:
- Multiple Document Interface
- Multi-Lingual
- Spanish
- French
- Portuguese
- English
- Contact Information Templates
- Platforms
- Windows 95
- Windows NT
- Generate FGDC Clearinghouse-ready files
- FAQ, HTML, Text, or XML!
- Helper windows
- Coordinate Converter
- Calendar
- Error Window
- Contact Editor
- Multilingual Keyword Lookup
- Online Help
- Duplicate Existing metadata entries
- Validate data with MP (Metadata Parser)
Metascribe: “The NOAA Coastal Services Center’s MetaScribe tool is designed to reduce significantly the labor required to produce metadata compliant with the Federal Geographic Data Committee (FGDC) Content Standard for Digital Geospatial Metadata (CSDGM). This software tool takes advantage of the fact that, within a collection of records for a given data type, the records are generally very similar in content, with only a few fields or phrases changing from one record to the next. MetaScribe delivers the greatest savings when used to create a collection of similar records. In fact, this tool is not appropriate for the creation of multiple metadata records with little redundant content.”
Metavist: “Metavist 2005, a software tool for the metadata archivist, is used to create metadata compliant with two of the Federal Geographic Data Committee (FGDC) metadata standards—“FGDC Content Standard for Digital Geospatial Metadata” (FGDC 1998) and “FGDC Biological Data Profile of the Content Standard for Digital Geospatial Metadata” (FGDC 1999).” Can be ordered on CD, or downloaded directly here.
Morpho: “Morpho allows ecologists to create metadata, (i.e. describe their data in a standardized format), and create a catalog of data & metadata upon which to query, edit and view data collections. In addition, It also provides the means to access network servers, in order to query, view and retrieve all relevant, public ecological data.”
NPS Metadata Tools And Editor: “The NPS Metadata Tools & Editor (MTE) is a custom software application for authoring, editing, and managing National Park Service (NPS) metadata. The MTE operates either as an extension to ArcCatalog versions 8.3/ 9.x or as a standalone desktop application. The MTE is intended to be the primary editor for metadata that will be uploaded to the NPS Data Store and produces XML metadata based on the NPS Metadata Profile. Metadata editing is accomplished with editing stylesheets that transform an XML metadata file into an editable record.”
SHAME: “SHAME is a library that leverages editors, presentations and query interfaces for resource centric RDF metadata. The central idea of SHAME is to work with Annotation Profiles which encompasses:
- how the metadata in RDF should be read and modified.
- what input is allowed, e.g. multiplicity and vocabularies to use.
- presentational aspects like order, grouping, labels etc.
These annotation profiles are then used to generate user interfaces for either editing, presentation or querying purposes. The user interface may be realized in a web setting (both a jsp and velocity version exists) or in a stand alone application (a java/swing version exists). ”
Three Tab Metadata Editor For ArcCatalog 8.* and 9.*: “The Three Tab Editor is a user interface for entering Federal Geographic Data Committee (FGDC) and ISO Metadata for ArcCatalog.
- It is composed of only four simple data entry pages, so there is less hunting and pecking for the required metadata fields.
- It writes the metadata to the ESRI metadata file found in any data set supported by ArcInfo 9.x (e.g. Coverages, Shape Files, Geo Databases, SDE Databases…)
- It allows the user to input the contact information once, and then it populates all three contact information sections with this contact data (e.g.. metadata creator, data creator, and data request contact).
- Pick lists are provided for most of the data entry fields. These pick list provide either a sample of the potential value, or a list of the potential domains that can be used in that field. These pick list can also be edited via the metadata.mdb file found in “C:\Program Files\ThreeTabEditor” directory
- The theme keyword pick list used by this editor is compatible with those required by the ArcIMS Metadata Server.
- Completion of the fields found in this editor will allow the user to meet the minimal ISO metadata standard.
- The editor is designed to allow users who complete all fields to pass through the metadata parser (mp) with minimal errors.
- The editor is linked to a Microsoft Access database that can be used to store your contact information and pull down lists. This database can be found in the tools installation directory (e.g. c:\Program Files\ThreeTabEditor).
- On-line linkage exists to the Image Map of the Content Standard for Digital Geospatial Metadata (CSDGM) from the tools interface. This provides user with a quick reference of how to complete the fields. “
USGS Formal Metadata: A suite of metadata tools, including mp, cns, xtme, Tkme, mq, and DBFmeta. The last is a tool “designed to facilitate the documentation of data contained in DBF files”
GeoNetwork opensource: “GeoNetwork opensource is a standards based, Free and Open Source catalog application to manage spatially referenced resources through the web. It provides powerful metadata editing and search functions as well as an embedded interactive web map viewer. This website contains information related to the use of the software.”
ht to Grant McKenzie.
On his excellent Thematic Mapping blog (now part of my blog roll), Bjorn Sandvik has been running a series on thematic mapping techniques in Google Earth. Examples have included choropleth maps, bar charts, prism charts, Collada objects, map legends, including examples of animated time series. If you’re into the techy part of this stuff, the series is well worth a look for the ideas you’ll get from it, and the downloadable example files. But for non-techy types, the prospect of learning how to do this might have been a bit intimidating. Heck, I find it intimidating, and I know at least a litlle about this stuff.
But Bjorn has taken his examples to the next level, by creating an online tool that can convert datasets to thematic Google Earth maps on the fly, the Thematic Mapping Engine:
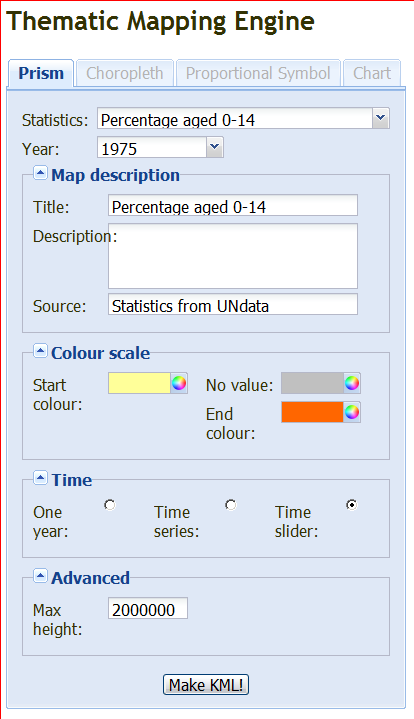
Only Prism maps are supported in this initial release, with other types (Choropleth, Proportional Symbol and Chart) coming in the future. You’re also currently limited in the datasets to 15 worldwide datasets from the UN, but the ability to import your own data is also coming. You can select data for one year, for a time series, or create a time map with a slider that lets you view the chart in animated format as the years roll by. The “colour” scale sets the endpoint colors for the chart, and these colors will be used to generate a legend for the chart. Click on Make KML, and you can download the KMZ file to your computer / open it in Google Earth directly:
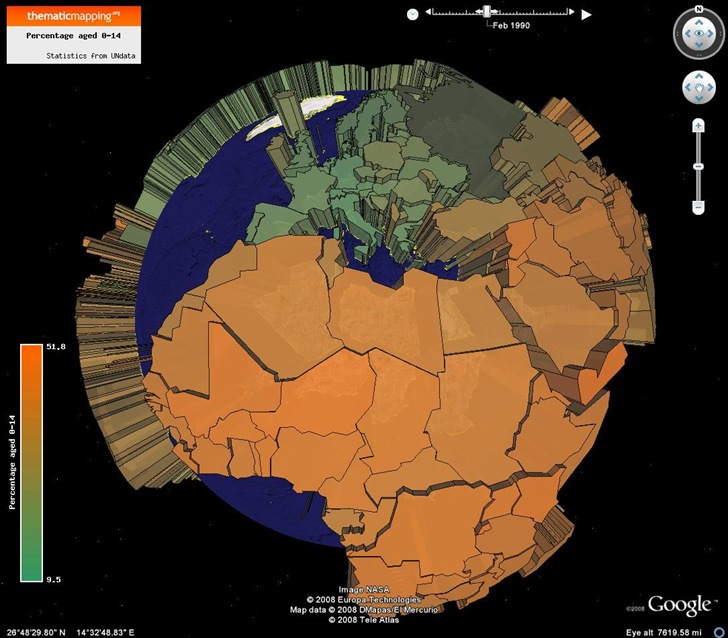
In Google Earth, use the slider at the upper right to change the data year, or click on the play button to see it animated.
I did find one minor quirk, but it’s likely a Google Earth bug. On my system, the first time I load one of these Thematic Mapping Engine KMZ files into Google Earth, I often see something like this:
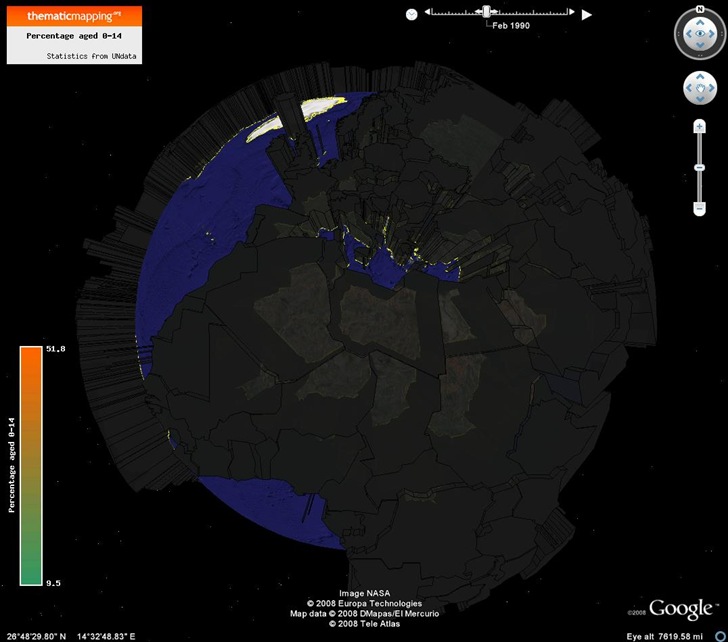
By turning the “sun” on (the View => Sun menu), and then turning the sun back off again, I get the correct view (i.e. the first picture). Resizing the Google Earth view can also create this effect, but the solution is the same.
The new stable release of MapWindow, with its built-in metadata editor and viewer, reminded me that I had a folder full of bookmarks to other metadata-related software. I may get around to longer posts on each of these at some point, but for now, I’ll just put up links and descriptions from the websites.
CatMDEdit: “CatMDEdit is a metadata editor tool that facilitates the documentation of resources, with special focus on the description of geographic information resources.” Note: Multiplatform, written in Java.
Computerized Process and Quality Assurance (CPQA): “CPQA is being developed as an automated QA/QC process for spatial data collection. It will assist the contract monitor and the contractor with this process and provide the Corps with the most efficient and cost effective means of evaluating a surveying and mapping project. The current version (CPQA Beta) is a Windows-based software package that assists the user in the production of a Scope of Work for surveys such as topographic, hydrographic, boundary, control, photogrammetric, etc. Based on user input and guidance from USACE Engineering Manuals and Engineering Circulars, the software provides suggestions as to the accuracy, scale, measurement density, etc., needed to complete specified projects. Later modules will assist in evaluating the quality of a survey and perform error checking on the survey information submitted by the contractor.”
Datalogr: “DataLogr is a free software package that helps people input and format metadata for geographic data. DataLogr (pronounced ‘data logger’) was developed and copyrighted by IMAGIN, a consortium of organizations in Michigan.”
Enraemed: “The Enraemed software is a freeware client/server or stand-alone metadata software collection tool. Enraemed will allow you to develop, archive and distribute your metadata according to metadata standards such as ISO, FGDC, Dublin Core and GILS. The backend database is Microsoft SQL.”
EPA Metadata Editor (EME): “The EPA Metadata Editor (EME) was developed to simplify and standardize geospatial metadata development across the Agency. It allows users to create and edit geospatial metadata records that meet the EPA Geospatial Metadata Technical Specification and Federal Geographic Data Committee (FGDC) Content Standard for Digital Geospatial Metadata (CSDGM) requirements.” Addendum: Requires ArcGIS 9.2 Service Pack 1 or higher
ImseVimse: “ImseVimse is a full-fledged graphical IMS metadata editor written in Java. It is a spin-off from the Conzilla project.”
Metadata Authoring Tool (MATT): “MATT runs from within a web browser such as Microsoft Internet Explorer, Netscape or Mozilla and has been written using a combination of XHTML and client-side JavaScript. Therefore it can be used either over the internet, across a network or directly from your hard-drive (offline).”
Metadata Enterprise Resource Management Aid (MERMAid): “NCDDC provides coastal data resources (organizations and individuals) with a web-based tool to develop, validate, manage and publish metadata records via secure internet access. The Metadata Enterprise Resource Management Aid (MERMAid) allows users/data providers to establish unlimited metadata databases to organize their metadata records any way they see fit (i.e. by program, project, data type, personnel).”
More in the next post …
PolicyMap is a new site that offers access to “over 4,000 indicators related to demographics, real estate, crime, health, schools, housing affordability, employment, energy, and public investments”, and lets you display them in map, tabular and graphical formats. While some datasets require a paid subscription, many are available for free. Datasets include:
- Real Estate Analysis
- Neighborhood Conditions
- Crime
- Mortgage Originations
- Education
- Money & Income
- Demographics
- Owners & Renters
- Jobs
- Energy
- Federal Housing
- Environment
- Schools
Below is a sample map showing elderly population in southern Florida:
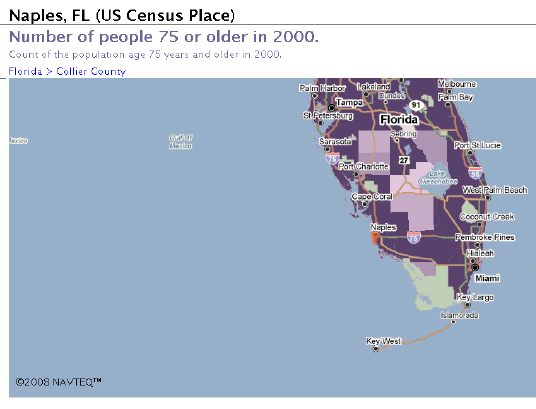
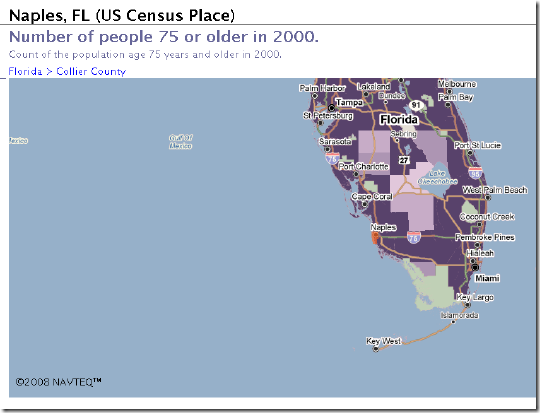
Maps can be exported in JPG or PDF format. Subscription buys access to more datasets, and the ability to upload your own data.
If you need a quick rundown of basic information about any country, the World Gazetteer is one option. From the site’s homepage:
- Current population figures and area size for all countries and important territories
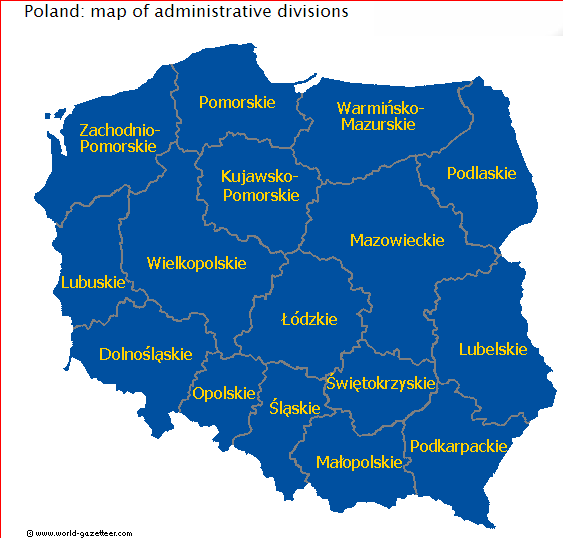
- Population figures and area size of administrative divisions
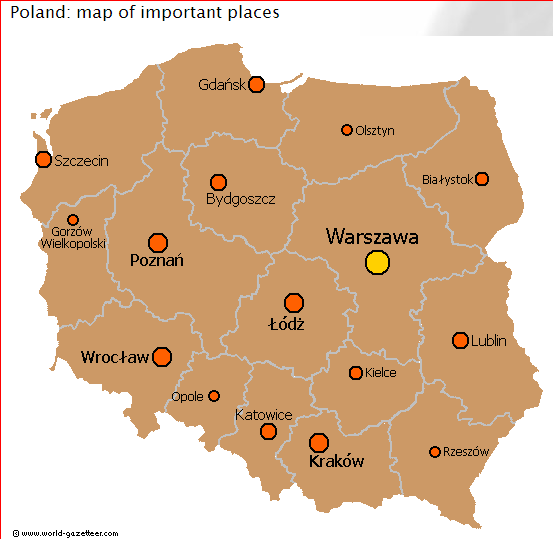
- Population figures for the largest cities, towns and places as well as for metropolitan areas
- Historical population data (census or estimates; mostly from last or last two censuses)
- Overview maps that show the position of the country or the administrative divisions
- Summary statistics for countries and territories as well as for the largest cities and agglomerations
- Current national flags
- Summary maps for various subject
- A pronunciation guide for some languages
- There is a downloadable file for offline research
- A population clock that show the current population of the world
- Comprehensive meta information about statistics and the project
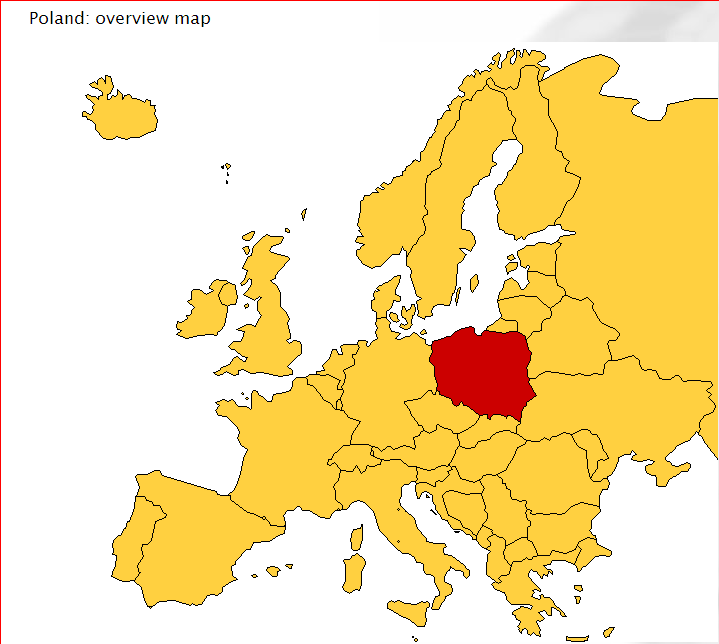
Sample maps from the website (for Poland):
I’ve covered the free GeoPDF plugin for Adobe Acrobat and Reader before, but the latest version adds a lot of new features:
- Create a point on the map, then open and view the corresponding point on Google Maps
- A lot more coordinate systems supported, including MGRS, Lambert Conformal Conic, Mercator, etc.
- Import and display shapefiles, re-projecting them on-the-fly
- Import Google Earth KML/KMZ data; also CSV and GPX files
- Annotate points with “sticky notes”, or with a GeoStamp symbol in various categories (incidents, infrastructure, operations)
- Draw rectangles, polylines and polygons, and annotate them
- Export annotated and imported data in shapefile format (automatically split into points, lines (arcs) and polygons)
- Export annotated and imported data in KML format for use in Google Earth (another way to convert shapefiles to KML format)
One capability that’s still missing is the ability to export the view in georeferenced raster format, like GeoTiff; hope that’s coming soon.
The TerraGo Technologies tutorials page has a video tutorial on GeoPDF, and brief written tutorial with sample data for you to play around with. You can also download free USGS topo maps in GeoPDF format from the USGS Store’s Map Locater and Downloader. While these are still mostly in raster format, the next generation of USGS topo maps will come in vector GeoPDF format, letting you select from up to 37 different data layers.
Stopped by the USGS Seamless Server recently for the first time in a while, and noticed they’ve added a drop-down list titled “Available Interactive Maps”. Listed there are a fairly wide-ranging set of data resources they’re working on; some are mostly duplicates of the Seamless Server data but with a slightly-different focus, while others contain unique data.
ARMI: A data viewer and retriever for the USGS’s Amphibian Research and Monitoring Initiative, a program designed to study and hopefully slow down the recent drastic reductions in amphibian numbers. Data includes factors like pesticides, hydrography, climate/weather and more.
USGS Projects In Afghanistan: Includes both an interactive data viewer and a list of downloadable data, including:
- Landsat data, including 6-band corrected imagery by 1:250K quads
- Aster Level 1A and 1B data
- SRTM 90-meter DEMs, with void filling
- German, Russian and USGS geology maps
- Full sets of Russian topographic maps, 1:50K and 1:200K
U.S.-Mexico Border Environmental Health Initiative: Interactive data viewer for “satellite imagery, orthoimagery and integrated geology, hydrology, transportation, geographical names, potential sources of contaminants, demographic data for population density, Nexrad daily weather, and boundary datasets”.
CEOS WG on Information Systems and Services: A viewer showing coverage areas for various forms of earth observation (satellite and aerial observations). Coverage areas only, no data.
Drought Monitoring: Drought and vegetation index data for the United States.
Elevation Derivatives For National Applications (EDNA): Hydrological-oriented database (30-meter US resolution) with raster and vector data:
- Aspect
- Contours
- Filled DEM
- Flow Accumulation
- Flow Direction
- Reach Catchment Seedpoints
- Reach Catchments
- Shaded Relief
- Sinks
- Slope
- Synthetic Streamlines
Integrated Vegetation Mapping Viewer: NDVI (normalized differential vegetation index), Fire Potential, Percent of Average Seasonal Greenness, and more.
MRLC: Focused on the National Land Cover Database (2001 and 1992).
MOPEX: Focused on stream, watershed and hydrological data for the US.
Topobathy: A few small sections of bathymetric shaded relief (e.g. off the coast of San Francisco, the Seattle bay area), but otherwise not much different than the USGS Seamless Server.