I first posted about HeyWhatsThat 2+ years ago; its initial functions included:
A panorama of what’s visible from that location, marking the position of peak geographic landmarks
A list of the peaks, and the ability to show their position relative to your location on Google Maps
Terrain profiles (elevation versus distance from the location to any point on the map).
A plot all the areas visible from that location in red on Google Maps (aka the “viewshed” or “weapons fan”).
Contour lines.
Google Earth export of position, viewshed, horizon line and horizon extent.
Mike Kosowsky has been adding functions to HeyWhatsThat since then, and writes to announce two more:
1. A simulator of Friday’s annular solar eclipse:
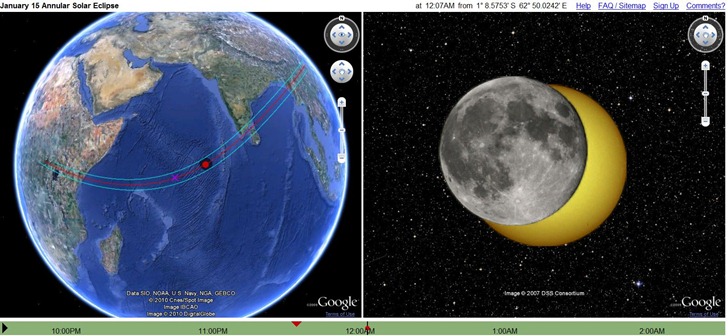
2. A web app to let you find out what you’re looking at using your iPhone or Android; point your phone’s browser to m.heywt.com.
A few years ago, I had several posts on the TatukGIS Viewer, a free program for viewing vector and raster GIS data. IMO the most valuable feature of this program was the ability to export georeferenced raster imagery of the view, with a great deal of flexibility in the resolution of the final output. Recently, TatukGIS announced a major upgrade to version 2.0 of the Viewer, the main improvement being on-the-fly reprojection of raster/vector data; previously, all the data had to be in the same coordinate system. Unfortunately, after trying it out, I discovered that they have removed the raster export function completely; it’s only available in their GIS editor, which costs $350. It’s still not a bad GIS viewer, but with the loss of this export function, I’d have to say you’d be better off learning how to use one of the free GIS viewers/editors that offer either on-the-fly reprojection, raster export, or both (e.g. gvSIG, qGIS, MapWindow, and many more – check my Big List Of Free GIS Programs posts for more). Plus, with these free/open-source options, you won’t have to worry about features being removed arbitrarily.
If you still want to try the new version of TatukGIS Viewer, make sure not to select the option that uninstalls the old version, like I did. Fortunately I had an older installer archived, as TatukGIS has removed all links to older versions.
So I’ve been following GPS Tracklog’s coverage of the Consumer Electronics Show last week in Las Vegas, and been underwhelmed by the handheld GPS announcements:
- Magellan announced nothing new.
- deLorme announced their PN-60 model; while it adds an interface with a Spot Satellite Communicator, the GPS capabilities are essentially the same as with the earlier PN-20/30/40 models.
- And Garmin announced the Oregon 450 and 450T, which join the Oregon 200, 300, 400, 400T, 400i, 400c, 550, 550T. They all pretty much offer the same GPS functionality with minor option tweaks (electronic compass, barometer, camera, built-in map sets).
At the same time, I keep getting asked by field professionals what the best handheld GPS is for serious field work. I have to tell them that there isn’t a single model currently available that does everything I’d like to see in such a unit, so they have to make some compromises. While professional-grade units are available from Trimble and Ashtech (formerly Magellan Pro), they tend to be much more expensive than consumer units, less rugged, have shorter battery lives, and run Windows Mobile (aack). And while they’re good at data recording, they’re nowhere near as good as standard consumer GPS models when it comes to navigation and map display.
There must be tens of thousands of field workers out there who would be a ready market for a reasonably-priced GPS that met their needs, like geologists, biologists, archaeologists, etc.. I’ve put together a list of what I’d like to see in such a unit; feel free to add your own suggestions in the comments. And it’s not like the requirements are all that difficult to meet; in one form or another, you can find most of the following features already present in at least one commercially-available consumer-grade model.
- High-sensitivity, high-speed, high-accuracy GPS chipset.
- Galileo/GLONASS support for higher accuracy.
- Readout of the Dilution Of Precision, plus a graph that shows you the DOP for the rest of the day so that you can choose times of lowest DOP to get the highest accuracy with your GPS measurements.
- A high-gain, omni-directional antenna. Many units these days come with just a small ceramic patch antenna, and tend to have less signal gain and be more orientation-sensitive than the “stubby” quad-helix antennas found on models like the Garmin 60CSx and the Garmin Colorado series.
- A decent-sized screen that’s easily visible in direct sunlight. 2.6” diagonal is a bare minimum, 3” is even better. Many recent models have higher resolutions and greater color depth than older models, but sacrifice daylight visibility as a result. I’d rather have a unit with fewer colors and lower resolution that you could use in daylight than a sexy high-tech screen where you can’t see anything on it unless you hold it in the shade with the backlight on.
- An easy interface for adding text. If it doesn’t detract from screen visibility, a touch screen is fine, but a slide-out keyboard would work as well.
- Buttons with programmable functions. One of the big problems with touch screens is that you sometimes have to dive multiple menu levels into the interface to access a needed function; the ability to call up such a function with a single button push would make life a lot easier.
- Decent battery life, at least 15-20 hours.
- Rugged and waterproof.
- More waypoints, tracks and trackpoints. Some models currently sold allow only 1000 waypoints, and 10,000 trackpoints, to be saved. I’ve never had to have more than several hundred waypoints myself, but I’ve hit my unit’s limit of 20 tracks and 10,000 waypoints many times.
- The ability to add your own GIS map data, like point/line/area shapefiles, for display on the unit, preferably with at least some attribute data.
- Loadable vector maps, from the manufacturer and/or custom maps created by the user or others.
- Raster imagery like topographic maps or aerial imagery, both standard mapsets (like USGS topos) and your own custom imagery.
- A tri-axial electronic compass that works regardless of how you hold the GPS.
- If you have a tri-axial compass, you have the electronics necessary to determine the angle of orientation of the GPS with respect to the ground. This would be useful for geologists (dip and strike), archaeologists (site maps), geomorphologists (ground slopes), botanists (calculations of tree height using angle), and presumably others as well.
- Some means for recording additional data associated with a waypoint. Standard waypoints are limited to about 30 characters in the note field, and expanding that to a larger size to add more info would be helpful; another option would be audio recording capability that’s linked to the waypoing.
- A built-in camera with both automatic geotagging, and automatic tagging of the direction the picture was taken in. 5-megapixel minimum, with autofocus and a macro mode for closeups.
- Bluetooth NMEA serial output so you can use it with a laptop or PDA.
It’s unlikely that any of the current manufacturers of consumer-grade GPS models will someday decide to create a “prosumer” model with a reasonable subset of the features above. But a guy can dream ….
… and he can also try to put together an affordable field-ready PC with GPS and GIS functionality. More on that soon.
New from MapChannels is Switch Maps, an easy way to embed multiple web maps in a single frame. A simple web interface lets you set the geographic extents, size of the map frame, and which maps to include:
Continue reading ‘Multiple Embeddable Web Maps With Switch Maps’
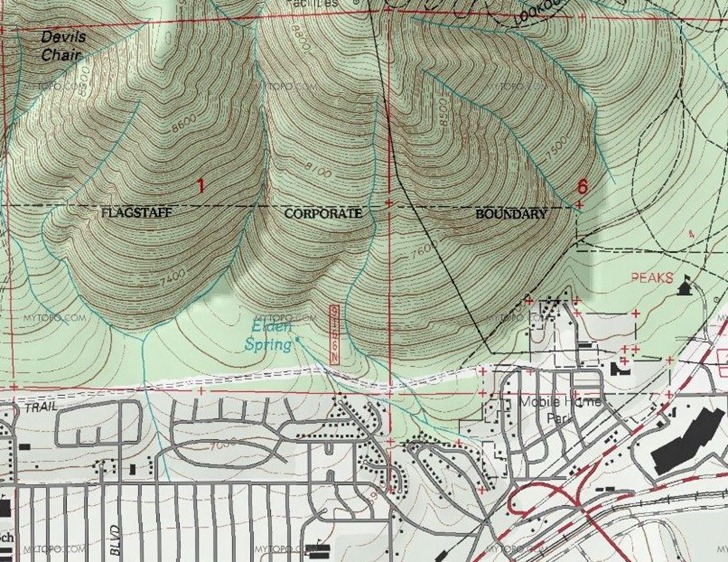
Joseph Elfelt writes to announce his Gmap4 website, which displays the MyTopo version of USGS topographic maps (down to 1:24K scale) and Canadian topo maps (to 1:50K) in a Google Maps interface; standard Google Maps layers are available as well. The initial map window view is pretty small; for a better view, select “Full Screen” from the action menu. The US topo maps are very high-quality terrain shaded maps, better than Terraserver, and substitute the updated US Forest Service topos where available:
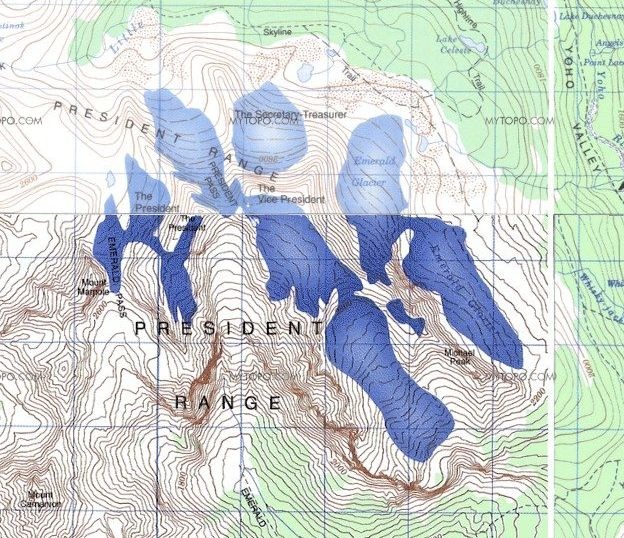
The Canadian maps generally look good as well, though they sometimes have issues with border mismatch between tiles, and differences in map lightness:
You can also display GPX and KML files on top of the topo maps, like this KML file:
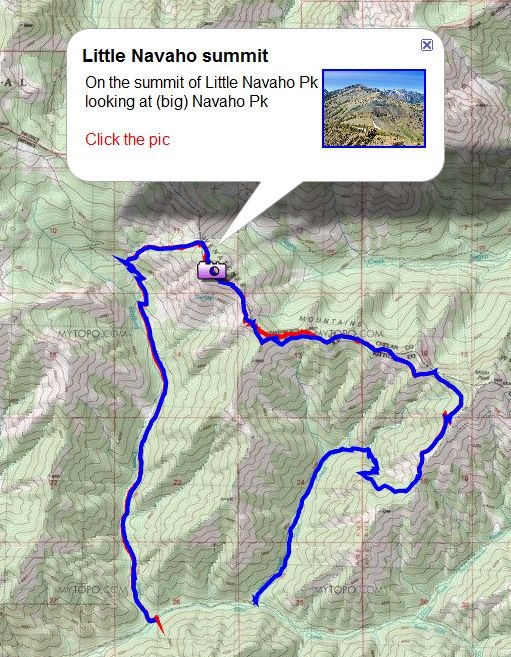
The help file, available as a PDF from the “Action” drop-down menu in the upper-right corner, explains how to do this three ways:
The site is non-commercial and ad-free, to conform to the licensing limitations of the MyTopo API.
With the UT-Bureau Of Economic Geology’s Scale Calculator, enter a map scale and it calculates what a measurement on the map represents in reality, or what a unit distance translates to at that map scale:
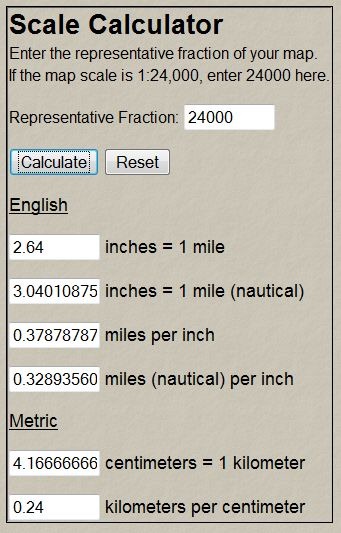
There are also links at the top of the page to other calculators for area/distance conversion, and decimal degree / deg-min-sec degree conversions (both ways).
The OSU Scale Calculator is a bit different – enter a map measurement distance for a unit distance, and get back the map scale number:
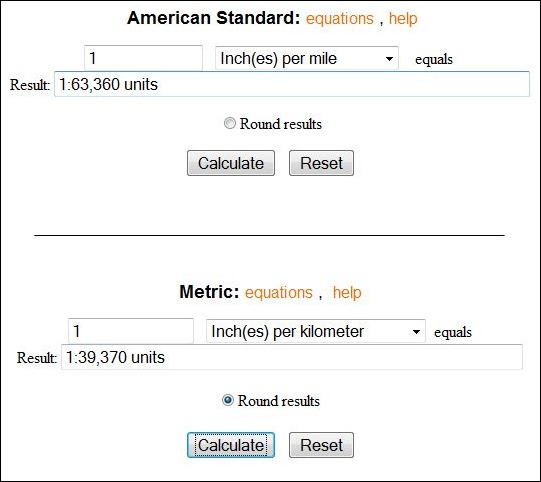
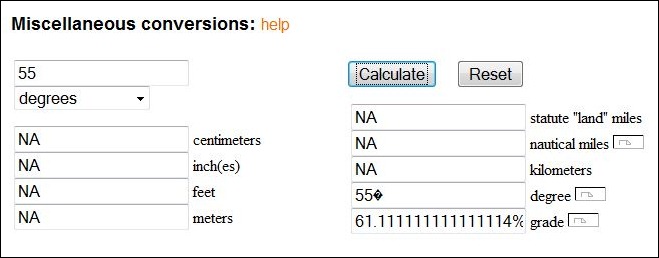
There’s also another calculator for basic distance unit conversions, plus also conversions from degrees of slope to % grade and back:
Via Kelso’s Corner (which also has some useful tables and info related to map scale),
The AfricaMap website from Harvard University offers dozens of vector and raster datasets that you can display inside of a Google Maps interface. Data categories include geographic, political, economic, environmental, linguistic, ethnic, historic and more. Most of the datasets can also be download in GIS-compatible formats, with a fair number also available in Google Earth KMZ format (indicated by a “3D” link in the data listing). Here’s a display of African language families from 2001, for which you can also download the original shapefile data:
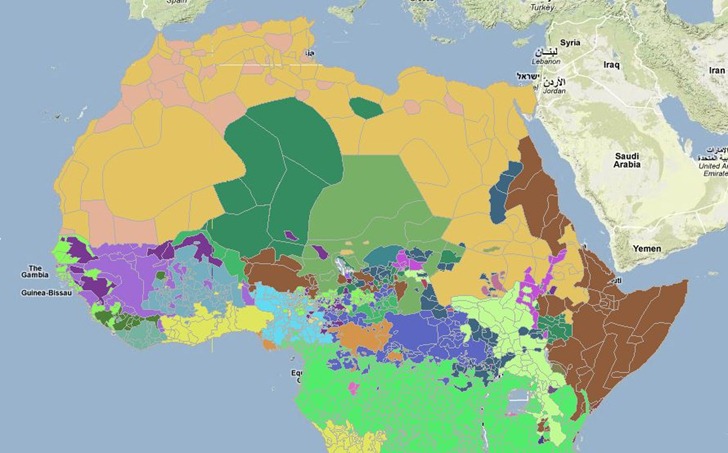
Zooming in will display labels, but you can also bring up a pop-up window with the map legend inside.
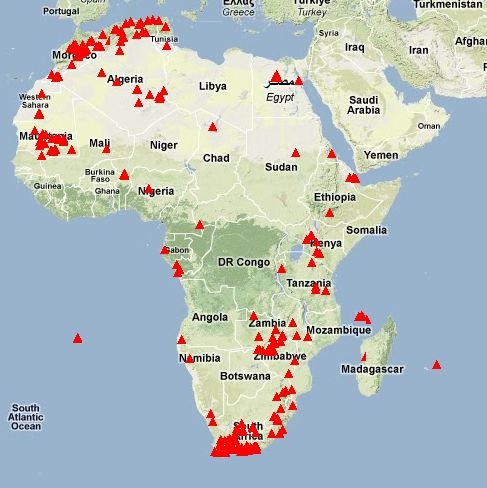
There’s also a “Places” tab that lets you plot point geographic locations for cities, lakes, canals, marshes, mountains, plateaus, and many more. Here’s a plot of gorges in Africa:
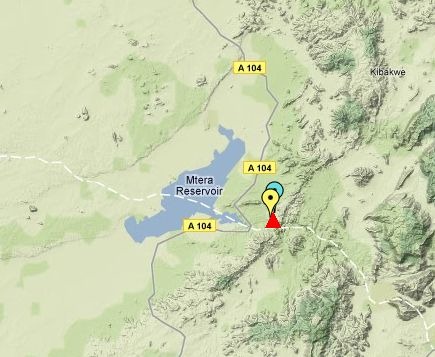
Zoom in closer to an area:
Click nearby a plotted location, and get a pop-up window with more information on the feature: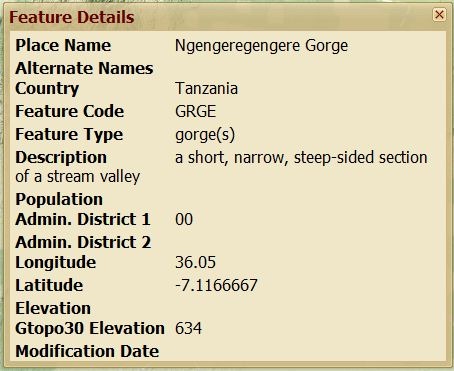
The Open Street Map project is working to create a freely distributable map dataset for the world, generated by volunteer effort. Much of the data is derived from publicly-available government data, GPS tracks, and manual tracing over aerial imagery. The Walking Papers project offers an alternative method of recording and adding data to the Open Street Map, more suited to ground-based observation and recording. Zoom in to an area, download a PDF of the map, and print it out; you have options to download simple or complex road maps, cycling-oriented maps, even topographical maps. Take it into the field, and write notes or draw geographical features directly on it; here’s a sample road map from France:
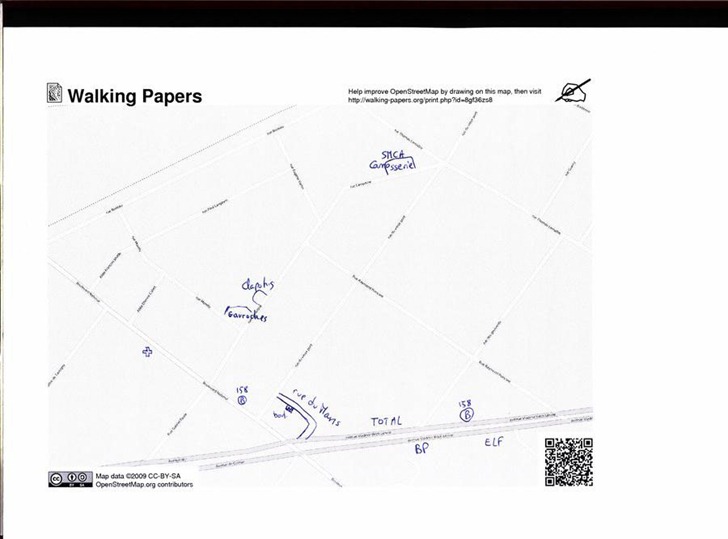
The square in the lower right has coded information about the location and scale of the map, and I’m guessing the squares help calibrate the map image. When you’re done annotating the map, scan it and upload it back to the Walking Papers website. You can then open up an OSM editor with the scanned map in the background, georeferenced so that it lines up with the existing data:
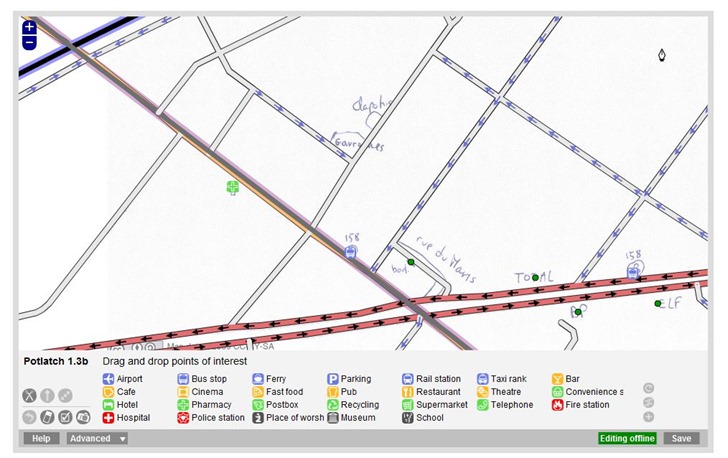
Use the editor to trace over the hand-drawn data, adding it to the OSM database.

